
19 April 2023
Last November eBird enhanced their Status and Trends website with cool interactive maps of overall abundance, weekly abundance, population trends and range for nearly 700 species. The population trends are fascinating for two reasons: northward movement and curious exceptions.
Many eastern species are moving their breeding ranges northward. For some it’s starkly obvious that they’re declining in the Southeastern U.S. and increasing in the northern U.S. and southern Canada. Click HERE to see 12 good examples at Cottonwood Post.
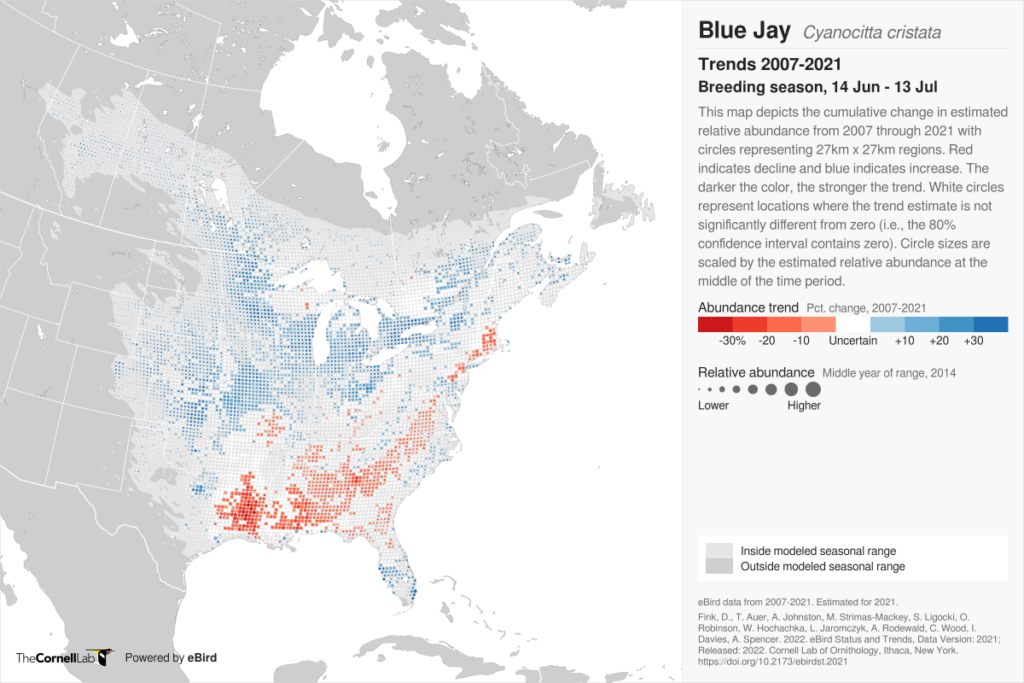
Blue jay (Cyanocitta cristata) trends are doubly fascinating. Jays are definitely moving north but with a curious exception in south Florida (why increasing there?). Check out their trends map. Blue is good, red is bad.
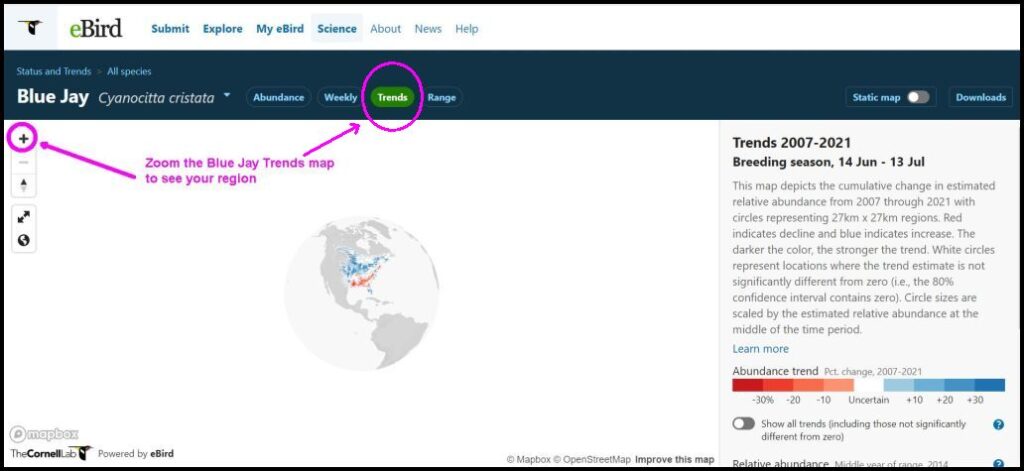
Most of Pennsylvania has no change in blue jay abundance but did you see the tiny red dot near Pittsburgh? Where is that decline? Drill into the map on the eBird website using these step-by-step screenshots to guide you.
First, click to Explore all Status and Trends Species on eBird. When you get there, click on Search all species at top right.

I searched for Blue Jay and got a global map. Click on the [Trends] button. Still too tiny! Click on the + sign at top left to zoom in.
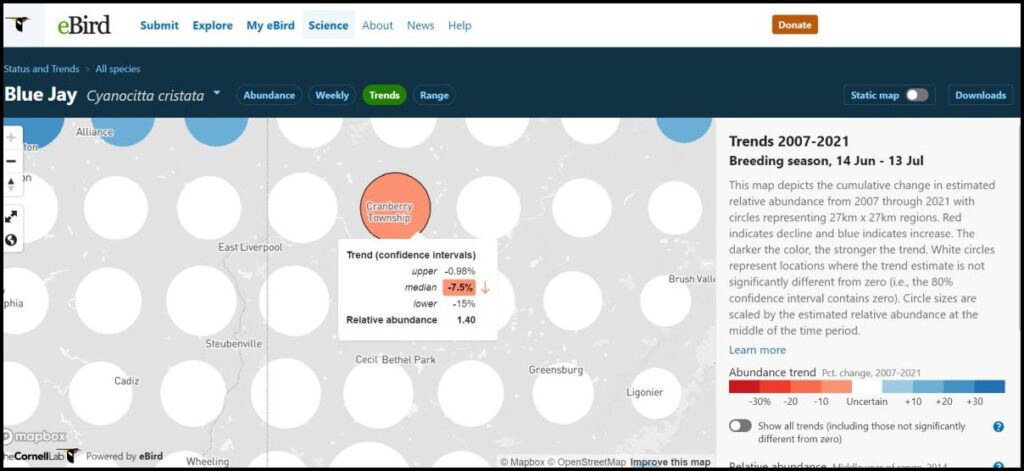
As I zoomed in it became apparent that nothing has changed (i.e. white dots) for blue jays in our region until I found that red dot in Cranberry Township. I hovered my cursor over it and found that blue jays declined there 7.5% from 2007 to 2021. I wonder why…
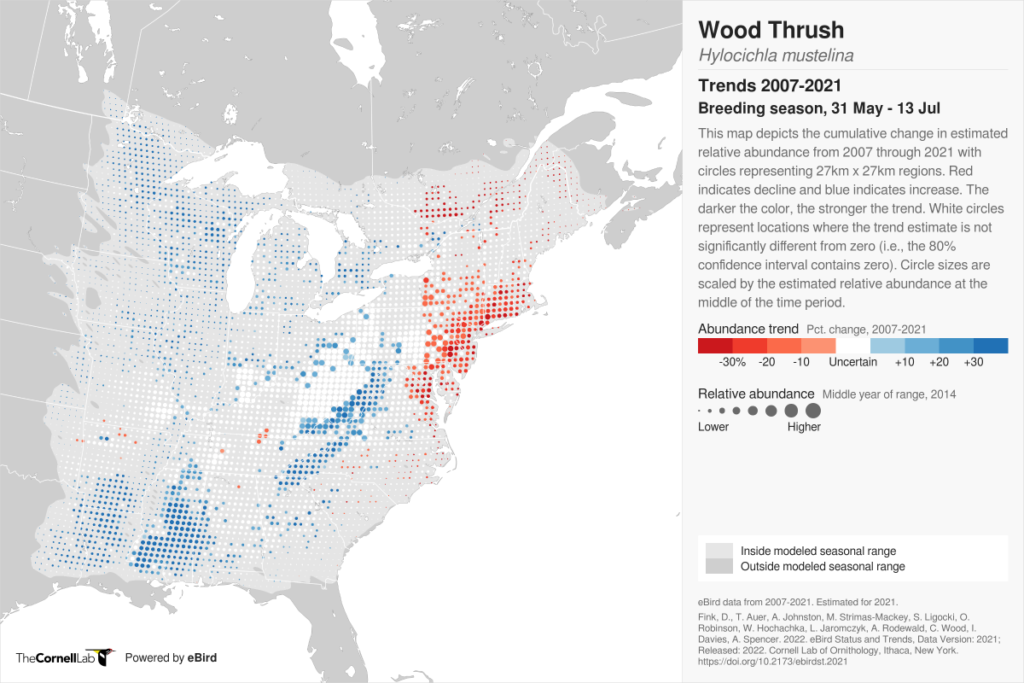
Meanwhile wood thrushes (Hylocichla mustelina) are the curious exception. Though declining overall their trends map doesn’t show the predictable north-south pattern.

Wood thrushes are declining in the Northeast but increasing in the Southern Appalachians and Alabama. A line of “No Change” runs from approximately Kingston, Ontario to Charlottesville, Virginia. Again, I wonder why…
Try this for yourself at Explore all Status and Trends Species at eBird.
(photos by Steve Gosser, maps from Cornell University eBird Status and Trends)
ebird species migration weekly abundance trends
According to The Guardian, the northward movement is happening in Europe too. (https://www.theguardian.com/environment/2020/dec/03/atlas-reveals-birds-pushed-further-north-amid-climate-crisis-aoe)
Conservationists there think that the driving issues are climate change and changes in land use, i.e. loss of habitat.
Could it be that the ‘curious exceptions’ are in places where there is less habitat loss? What do you think?