Snow on sweet gum seed balls, Pittsburgh, 17 December 2020 (photo by Kate St. John)
4 January 2023
Rain. Rain. Rain! For two days it’s been raining in Pittsburgh while the high temperature holds at 61oF. Total rainfall will be 1.4 inches, some of which splashed the Cathedral of Learning falconcam.
Rain distorts the Cathedral of Learning falconcam, 3 January 2023
If the weather had been below freezing we’d be looking at 14 inches of snow! I’m glad it isn’t snowing but heavy rain in January got me thinking … Wasn’t the snow deeper when I was a kid?
I grew up in Pittsburgh so my memories of winter apply to where I live today, but are my memories distorted? Using Pittsburgh’s historical snowfall data I compared my 12 years of growing up in Pittsburgh(*) to the most recent 12 years.
The answer is mixed. There was more snow in winter when I was a kid (maximum winter total and highest minimum), but both the highest and lowest snowfall per month both occurred in the recent past — in fact in the same winter of 2020-21.
Description
When I Was a Kid
Inches
Inches
The Last 12 Winters
Max Winter Total
Winter 1960-61
76.0
63.4
Winter 2013-14
Min Winter Total
Winter 1968-69
30.4
22.4
Winter 2019-20
Max Monthly Total
Jan 1966
24.6
27.5
Jan 2021
Min Monthly Total
Mar 1961
1.4
0.1
Mar 2021 (same yr as max)
Snow in May?
Up to 3.1 inches
No snow sticks in May
The wild swings in snowfall nowadays mirror the wild swings in temperature.
Remember how bitter cold it was only 11 days ago? Look at the temperature swing then (Christmas Eve 2022) and now (3 January 2023)!
So the answer is Yes & No. Yes, there was more snow in Pittsburgh when I was a kid. But, No, the snow is deeper today on rare occasions.
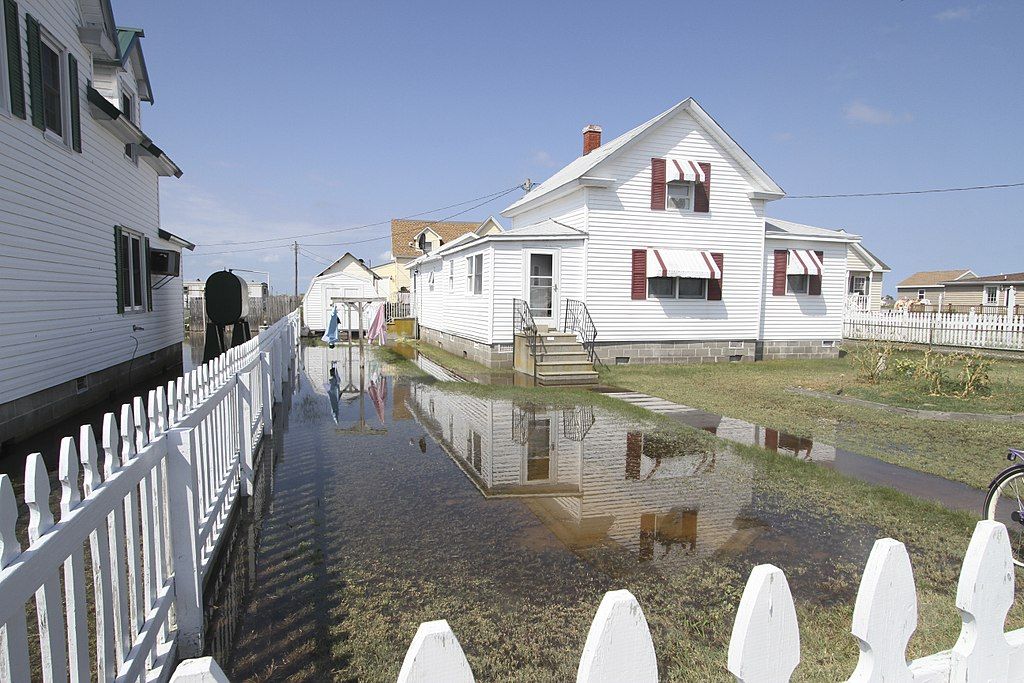
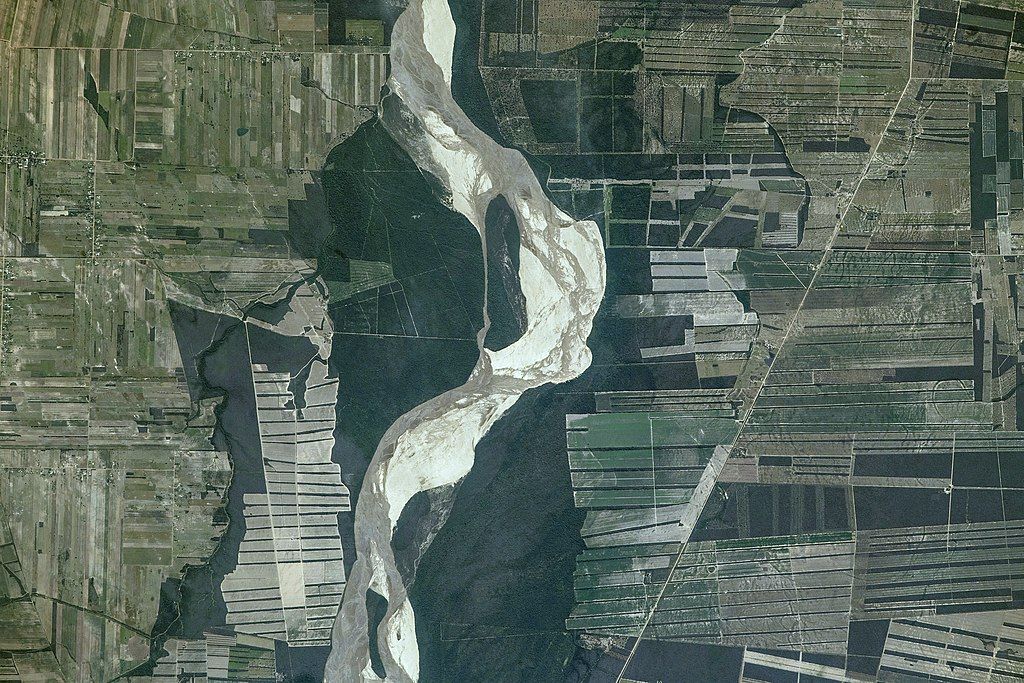
Sea level is rising overall about 3 millimeters (0.1 inches) per year due to climate change but Chesapeake Bay is rising even faster than the ocean — as much as 4.6 millimeters per year — because the area is still subsiding after the last Ice Age. Some Chesapeake Bay islands are disappearing.
NASA’s Landsat images of lower Chesapeake Bay from 1999 and 2019 show how much land has been lost in only 20 years. In 1999 there were white sand beaches on the island edges. By 2019 the beaches are gone and Great Fox Island in the center of the image has almost disappeared.
The Chesapeake Bay Foundation used to hold in-residence educational programs on Great Fox (also called Fox Island) but in October 2019, with only 34 island acres left, they declared the end of the program. You can see why in the video below.
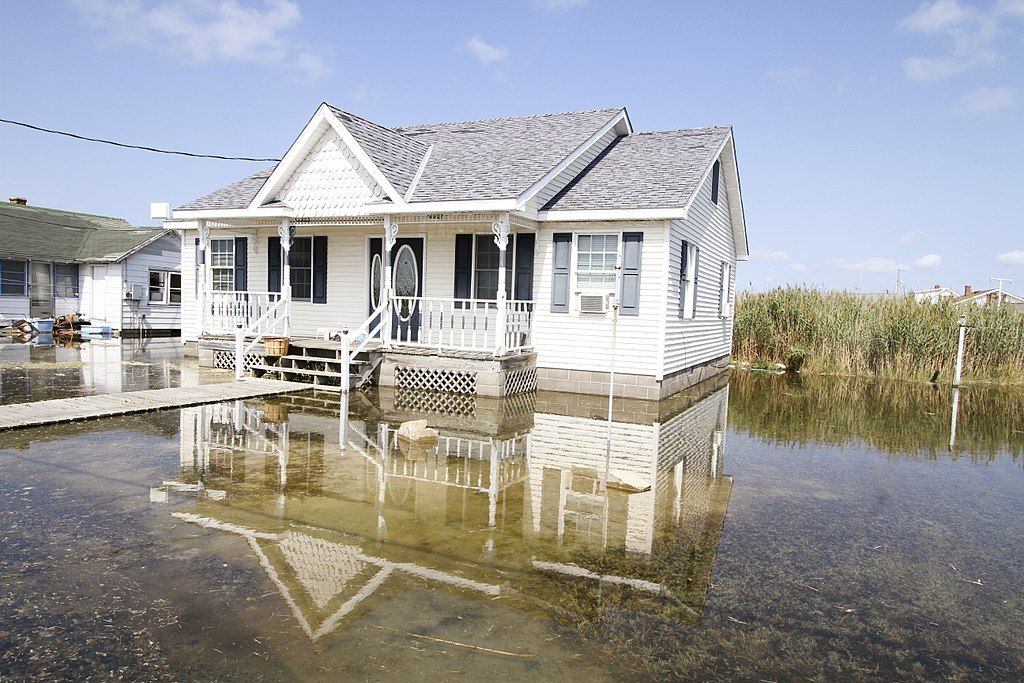
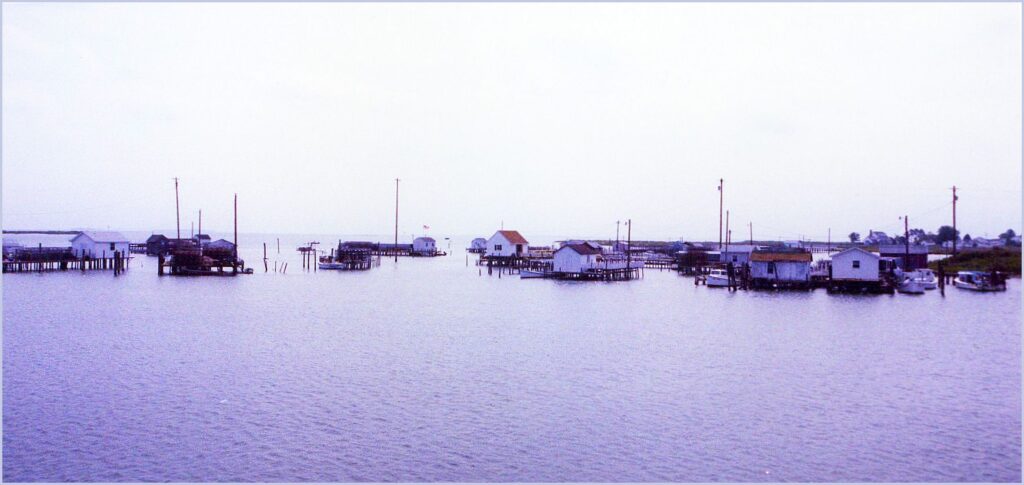
Just across the Virginia line (at the bottom of the satellite images) is Tangier Island whose land mass has shrunk 67% since the 1850s. Its population shrank as well. By now Tangier has only 345 acres and a population of about 470.
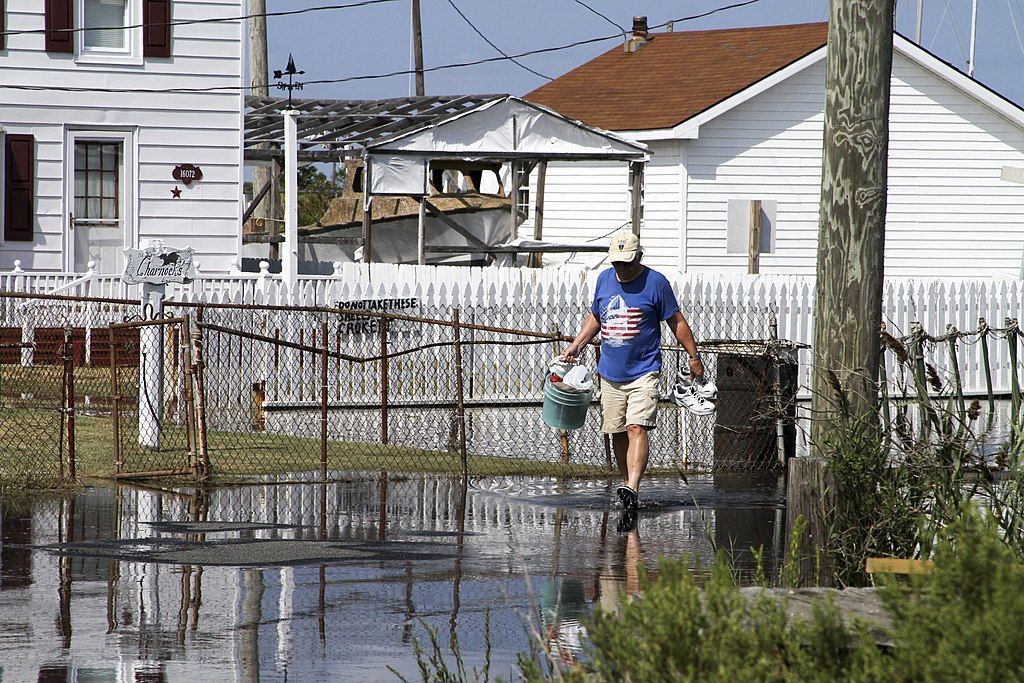
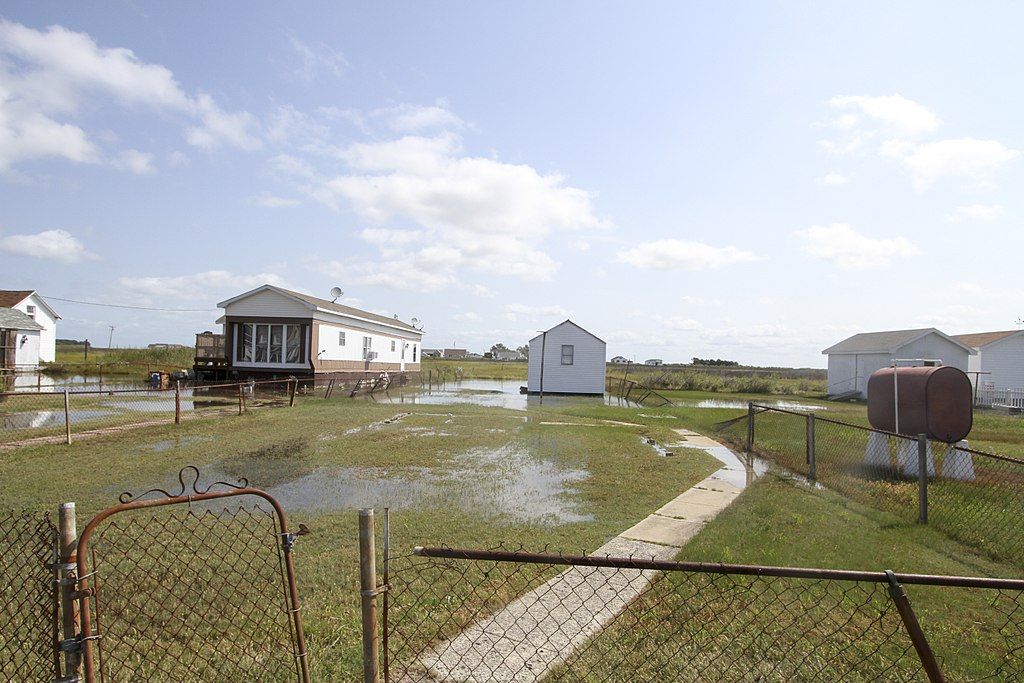
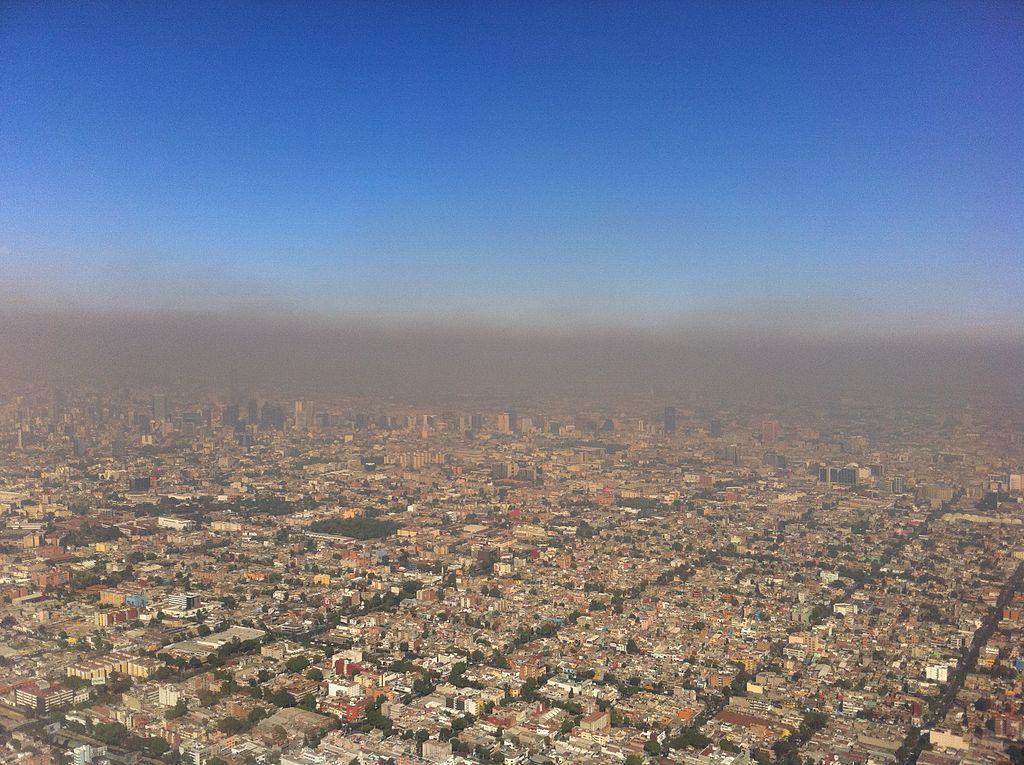
Residents are routinely flooded during the highest tides, pictured at top and below.
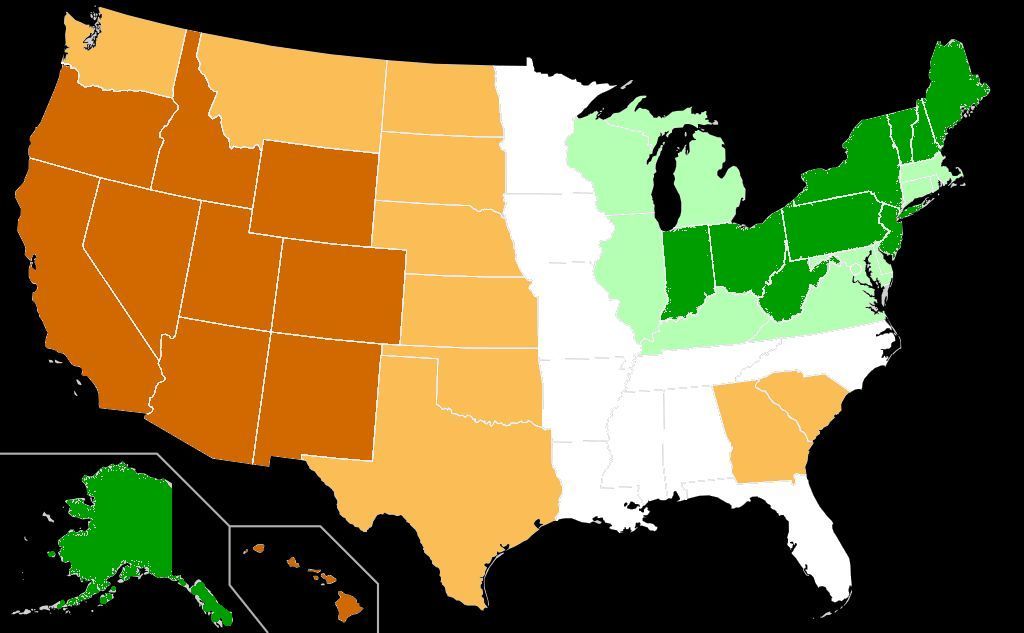
Ranking the states by average percentage of land in drought, 2000-to-March-2021 (original map from Wikimedia Commons colored by Kate St. John)
27 November 2022
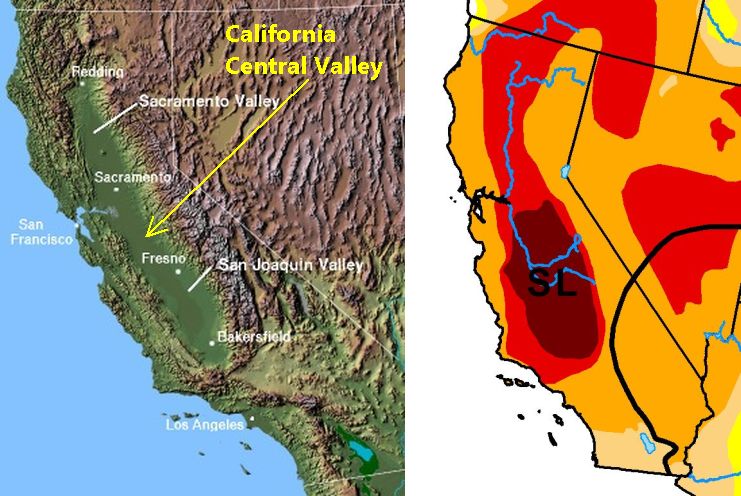
The western U.S. has always been drier than the east but as climate change heats up the planet, drought has become more prevalent. NOAA’s quarterly weather outlooks now include a 3-month drought prediction along with temperature and precipitation forecasts. Some places are more likely to experience drought than others. Which states are more likely? Which are least?
The graphic above is based on Stacker’s article, States With the Worst Droughts, that ranks states by average percentage of land in drought from 2000 to March 2021. Listing the states in order, I grouped them in 10s with darkest Orange indicating the top ten drought states and darkest Green for the 10 wettest. (White = the middle 10)
The top state for drought is Arizona. No surprise; it’s a desert.
The state with the least drought is Ohio!
Georgia and South Carolina stand alone with a lot more drought than their neighbors. Their drought ranking is like Kansas.
Hawaii (dark orange) and Alaska (dark green) are at opposite extremes.
As climate change continues to unfold human populations will migrate from less habitable to more habitable locations. In the U.S. we can expect people to move west to northeast in the coming century — from more drought to less.
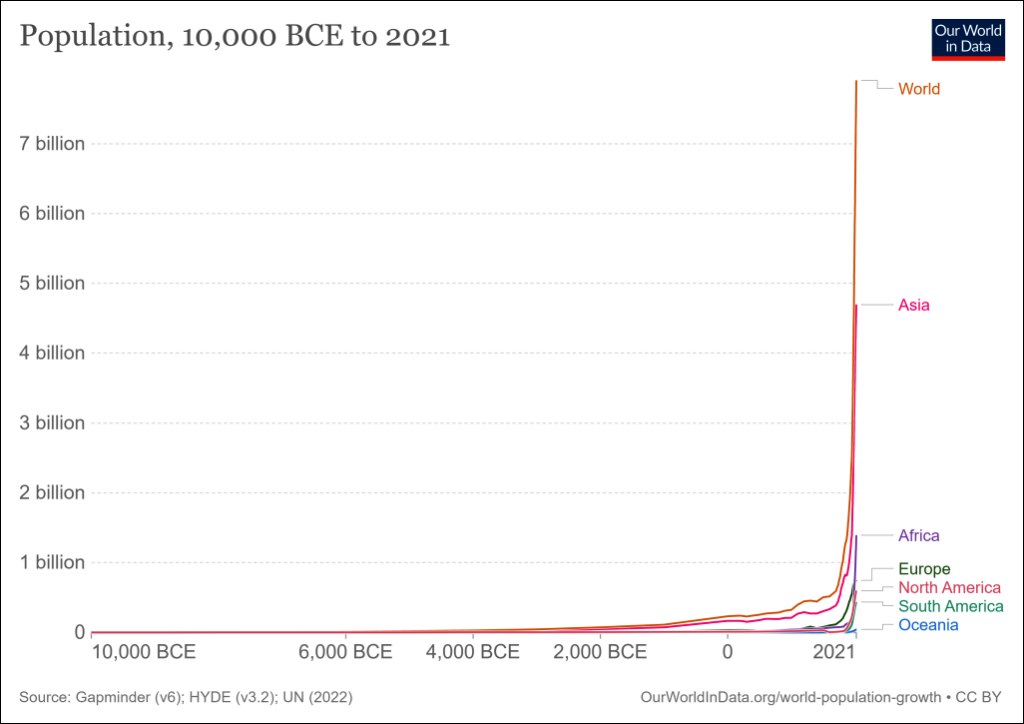
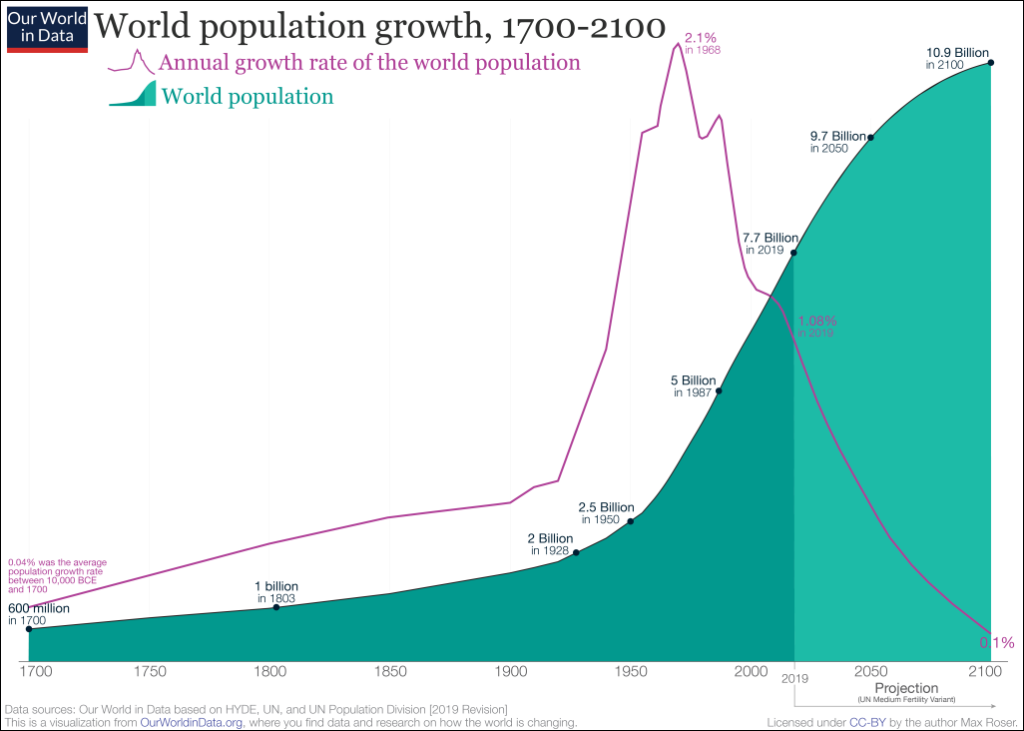
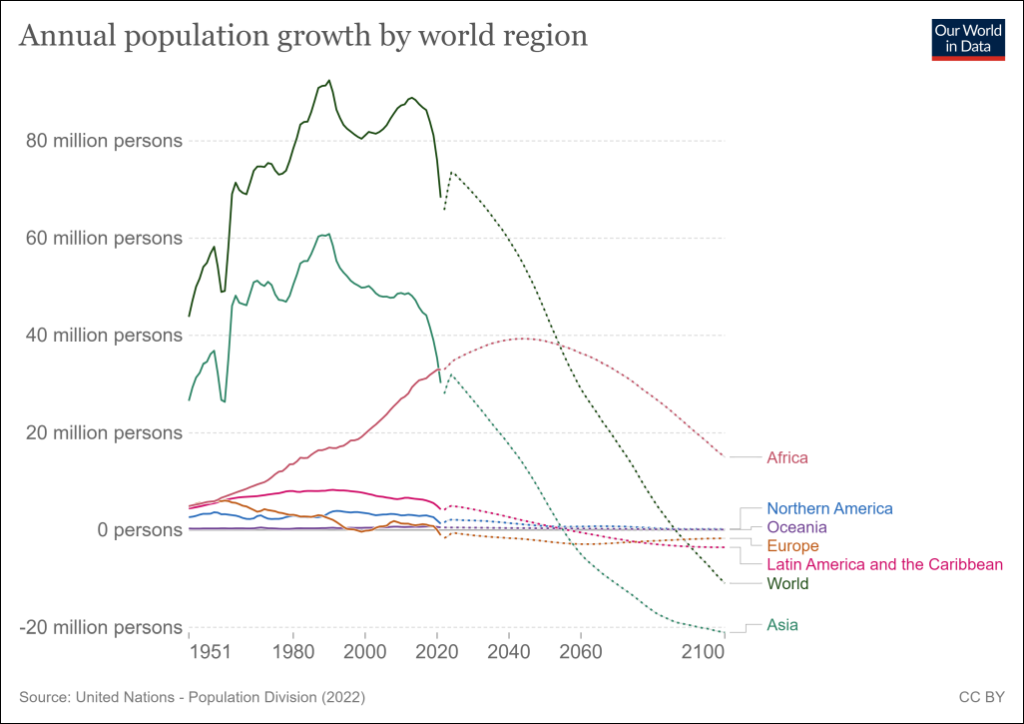
Today the global human population has reached 8 billion. Lest we think our current growth rate is normal, this graph shows that human population since 10,000 BCE (the start of agriculture) has had a rapid and unnatural growth spurt in the last 70 years.
This rate of growth is unsustainable and somehow our species naturally knows it. Population growth will continue but is slowing to a rate of only 1% by the end of this century. Unfortunately there will be 10.9 billion of us by then!
Asia will lead the world in slowing the rate while North America remains relatively stable. (Note: The dip in 2020 is COVID deaths outperforming births.)
The archaeological record shows that life on Earth has experienced five mass extinctions in which 70% to 90% of all species disappeared (*). After each extinction life came back.
The extinction rate today indicates we are now in the midst of a sixth mass extinction. Scientists predict that due to human pressure, habitat loss and climate change as much as 50% of all species will go extinct by 2100. [1] [2] [3] [4]
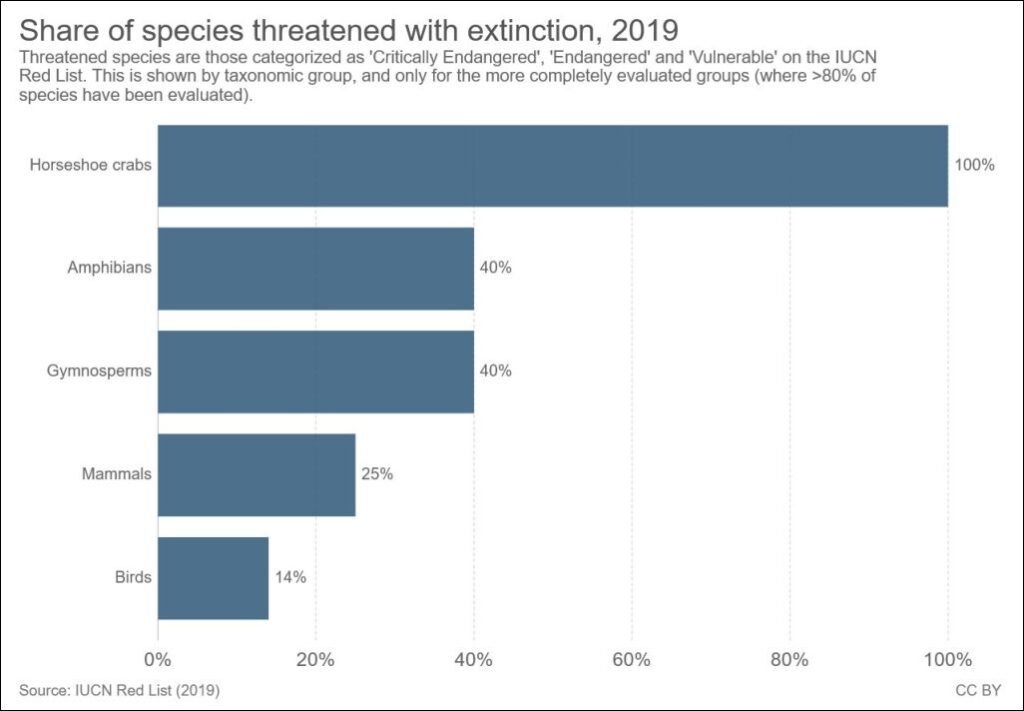
Interestingly, the IUCN Red List’s extinction ranking shows that birds may not fare as badly as many other organisms. It’s bad news for conifers, frogs and horseshoe crabs, though.
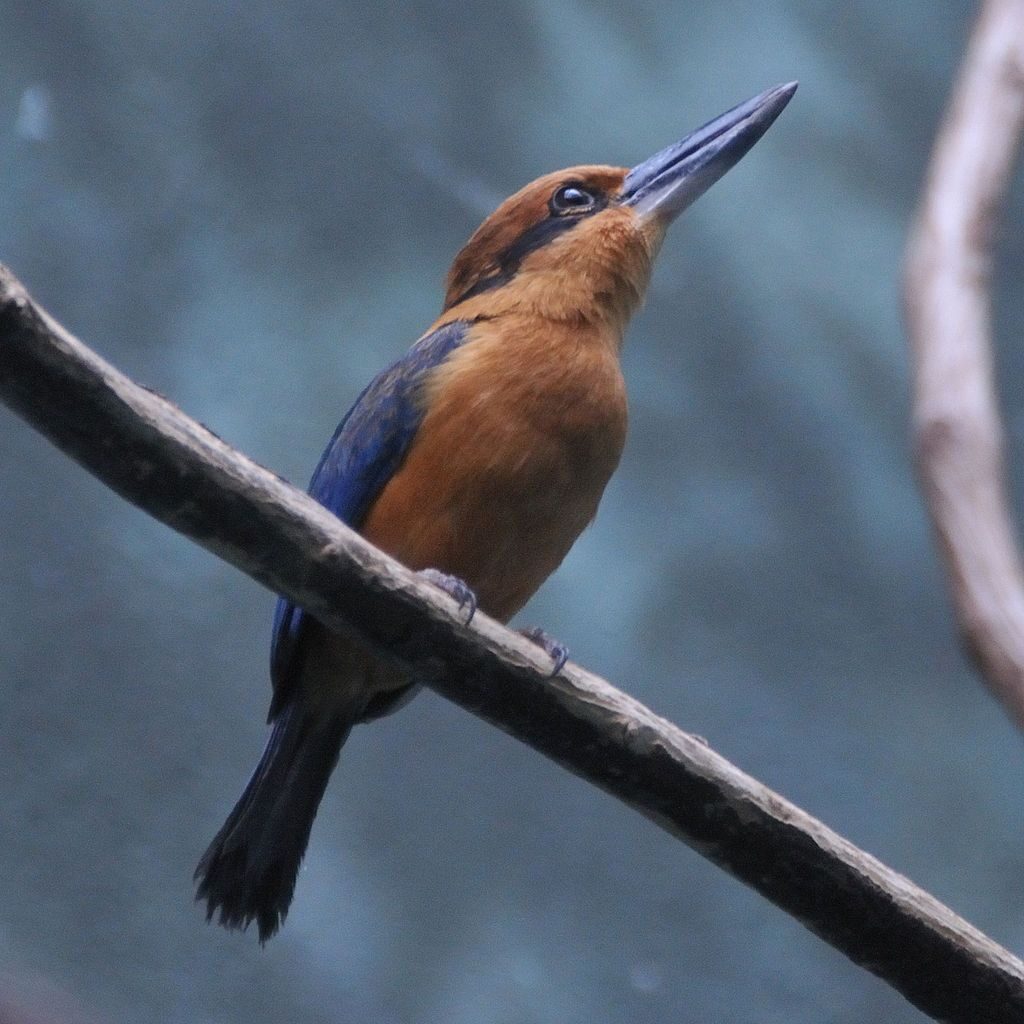
from Wikimedia Commons
In the short term we are helping some species such as the Guam kingfisher (Todiramphus cinnamominus), shown above, already extinct in the wild and in a captive breeding program. In the long term we humans could change our ways to slow or stop species decline. Knowing humans, it doesn’t look good. We can mourn the future but if we take a very long view there is hope.
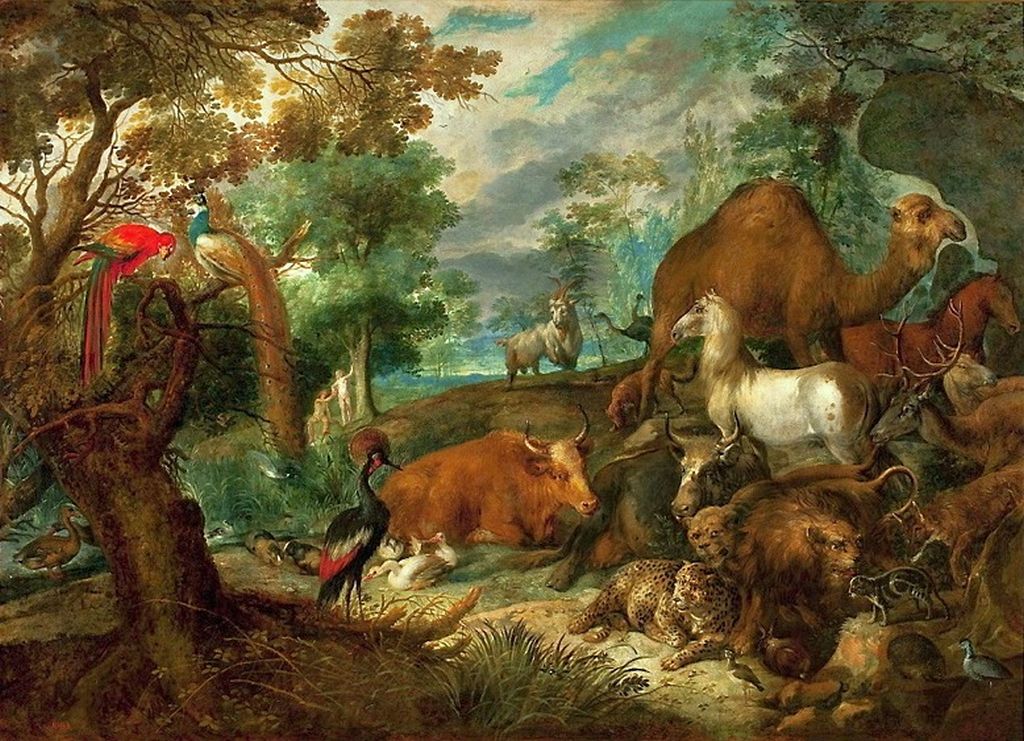
After the sixth mass extinction, what will happen next?
David Quammen‘s article Planet of Weeds in Harper’s October 1998 described the current mass extinction and asked eminent paleontologist David Jablonski “What next?” The article is quoted below.
Among the last questions I asked Jablonski was, What will happen after this mass extinction, assuming it proceeds to a worst-case scenario? If we destroy half or two thirds of all living species, how long will it take for evolution to fill the planet back up? “I don’t know the answer to that,” he said. “I’d rather not bottom out and see what happens next.” In the journal paper he had hazarded that, based on fossil evidence in rock laid down atop the K-T event and others, the time required for full recovery might be five or ten million years. From a paleontological perspective, that’s fast. “Biotic recoveries after mass extinctions are geologically rapid but immensely prolonged on human time scales,” he wrote. There was also the proviso, cited from another expert, that recovery might not begin until after the extinction-causing circumstances have disappeared. But in this case, of course, the circumstances won’t likely disappear until we do.
Still, evolution never rests. It’s happening right now, in weed patches all over the planet. … So we might reasonably imagine an Earth upon which, ten million years after the extinction (or, alternatively, the drastic transformation) of Homo sapiens, wondrous forests are again filled with wondrous beasts. That’s the good news.
440 million years ago: Ordovician-Silurian Extinction: Small marine organisms died out at a time when life only existed in the oceans. 85% of all species went extinct.
365 million years ago: Devonian Extinction: Many tropical marine species went extinct. 70% of all species lost.
250 million years ago: Permian-triassic Extinction: The largest mass extinction event in Earth’s history. 90% of all species.
210 million years ago: Triassic-jurassic Extinction: The extinction of other vertebrate species on land allowed dinosaurs to flourish. 70% to 75% of all species went extinct.
65 million years ago: K-Pg (or K-T) Extinction: The event that killed the dinosaurs. 75% of all species lost.
Chimney swift flying in Austin, Texas (photo by Jim McCullough, Creative Commons license, Wikimedia Commons)
Rufous hummingbird (photo by Steve Valasek)
American Golden Plover in spring (photo by USFW in public domain on Wikimedia Commons)
Whimbrels wintering in Singapore (photo by Lip Kee via Wikimedia Commons)
Lesser Yellowlegs in flight (photo by Chuck Tague)
Male evening grosbeak, 6 Nov 2012 (photo by Marcy Cunkelman)
Bobolink, adult male (photo from Wikimedia Commons)
Golden-winged warbler (photo from Wikimedia Commons)
Prairie Warbler at Tomoka, Florida (photo by Chuck Tague)
20 October 2022
Just over a week ago the Cornell Lab of Ornithology published the 2022 State of the Birds in the U.S. The news was sobering. Population declines of 90 bird species have reached a tipping point into endangered status, having lost half or more of their populations since 1970.
70 of these species are on a trajectory to lose another 50% of their populations in the next 50 years if nothing changes. (That means losing another half of what’s left!) The slideshow above shows ten of my favorites that are falling off the cliff into the sixth mass extinction.
Of the 20 remaining species whose future is bleak I will especially miss the black-billed cuckoo, snowy owl, red-headed woodpecker, olive-sided flycatcher, wood thrush, and mourning, cerulean and Canada warblers.
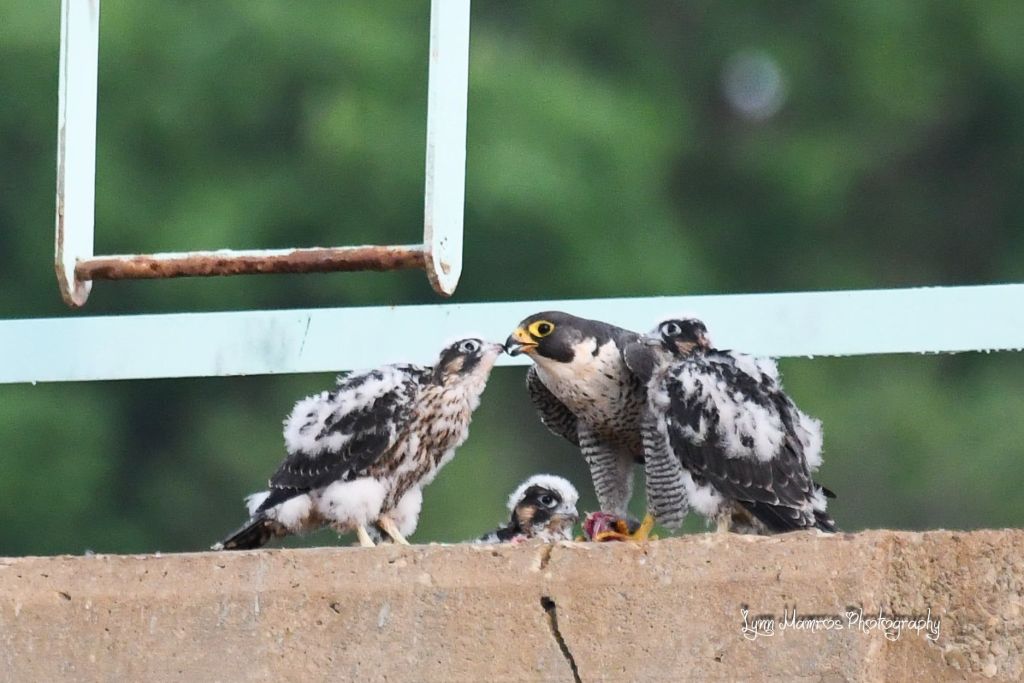
Fortunately Cornell Lab describes actions we can take right now to turn this around, illustrating The Road to Recovery with one of the greatest recoveries of our lifetime: the peregrine falcon. We made a difference in the last 50 years and we can do it again. Click here to learn what you can do to help birds.
Peregrine falcon feeding young at Tarentum Bridge, May 2021 (photo by Lynn Mamros)
(photo credits in the captions. All of these photos were used in prior articles.)
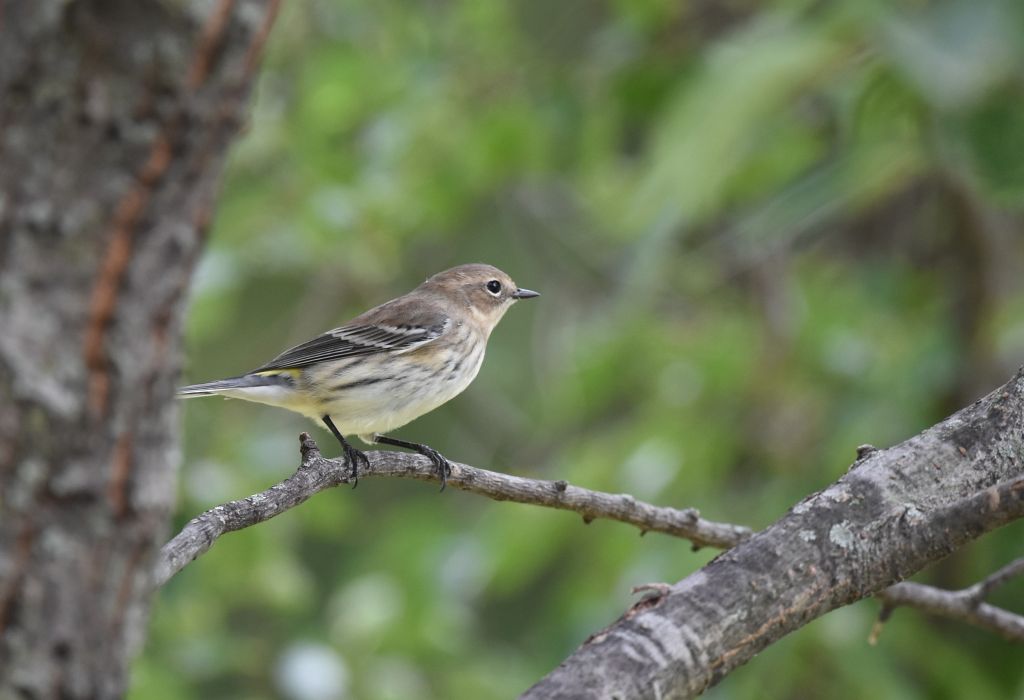
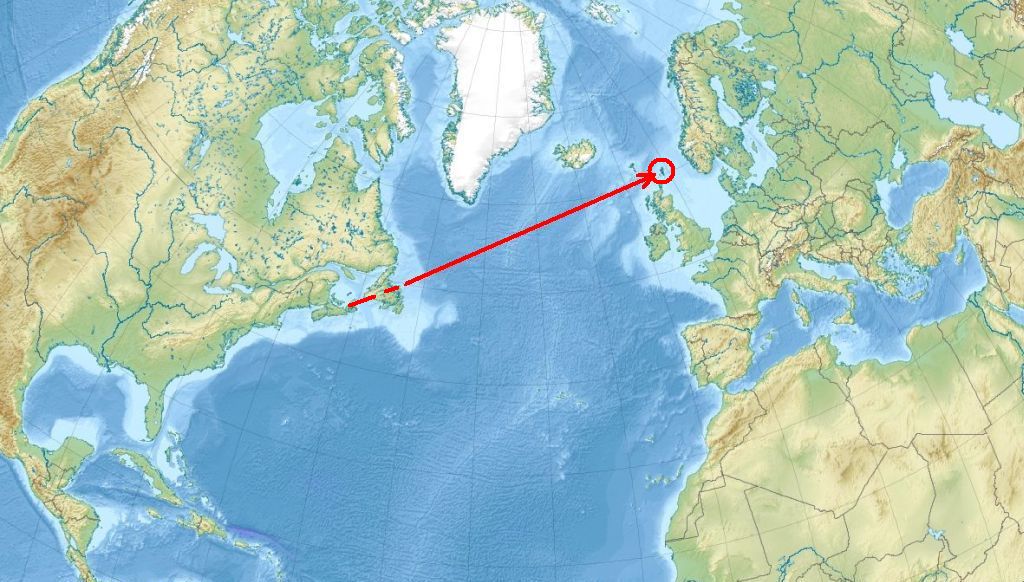
There was much excitement in British birding this week when two yellow-rumped warblers (Setophaga coronata) and a first-ever least bittern (Ixobrychus exilis) were sighted in the Shetland Islands, the northern tip of Scotland.
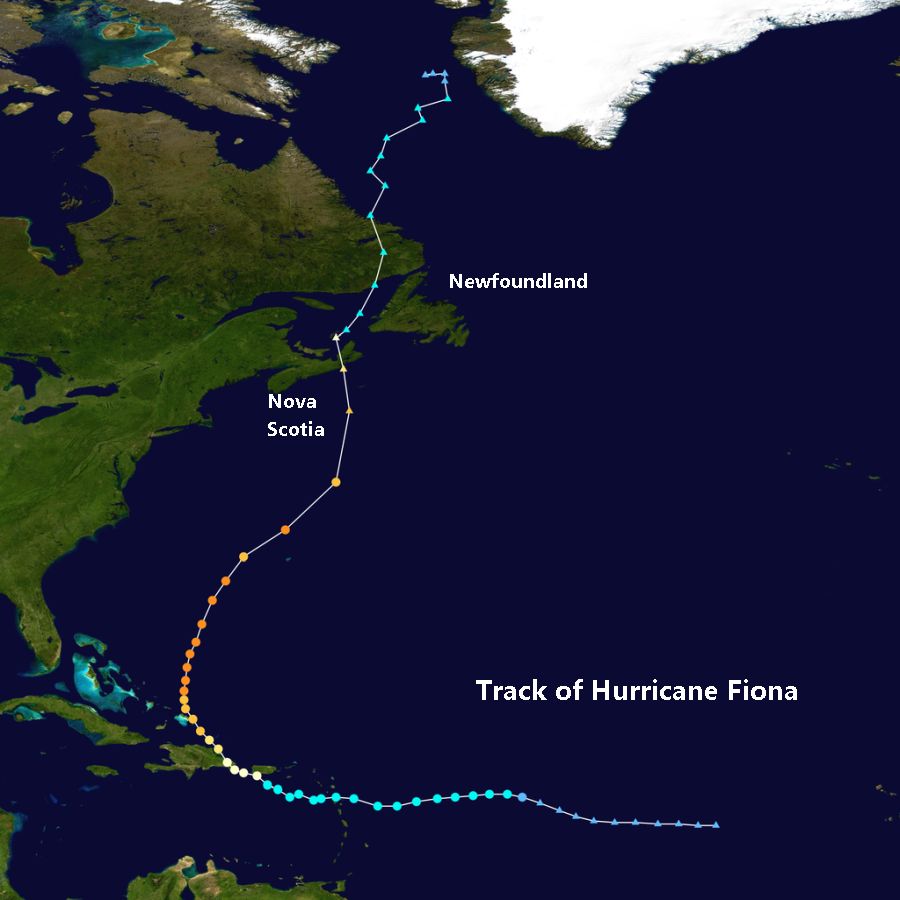
Both species are found only in the Americas but all three birds crossed more than 2,200 miles of the North Atlantic non-stop, likely forced offshore from the Canadian Maritimes or Newfoundland to escape Hurricane Fiona, the strongest hurricane ever recorded in Canada.
The birds were found more than 10 days later in the Shetlands on 5-7 October. It is hard to imagine their ordeal. The yellow-rumped warblers seem fine but the least bittern was exhausted and underweight and was taken to rehab where it died overnight.
Catch the excitement of seeing birds far from home in these tweets from British birders.
Oh my God!!! I’ve found a MYRTLE WARBLER on #Shetland today. All those days of resisting chasing other people’s birds and trying to find my own really paid off today #Megapic.twitter.com/euPCYv9mme
I am impressed that the warblers gravitated to the only trees in the landscape. This is similar to warbler behavior at Magee Marsh in May when they are found in small patches of trees — the only trees among miles of marsh and farmland.
The least bittern was found hunched on the shore, not in good shape. It died that night in rehab.
9 October 2022. There’s more: A first-ever Empidonax flycatcher in Ireland and a Baltimore Oriole in Devon, UK. Unfortunately the Baltimore oriole was eaten by a sparrowhawk (an Accipiter).
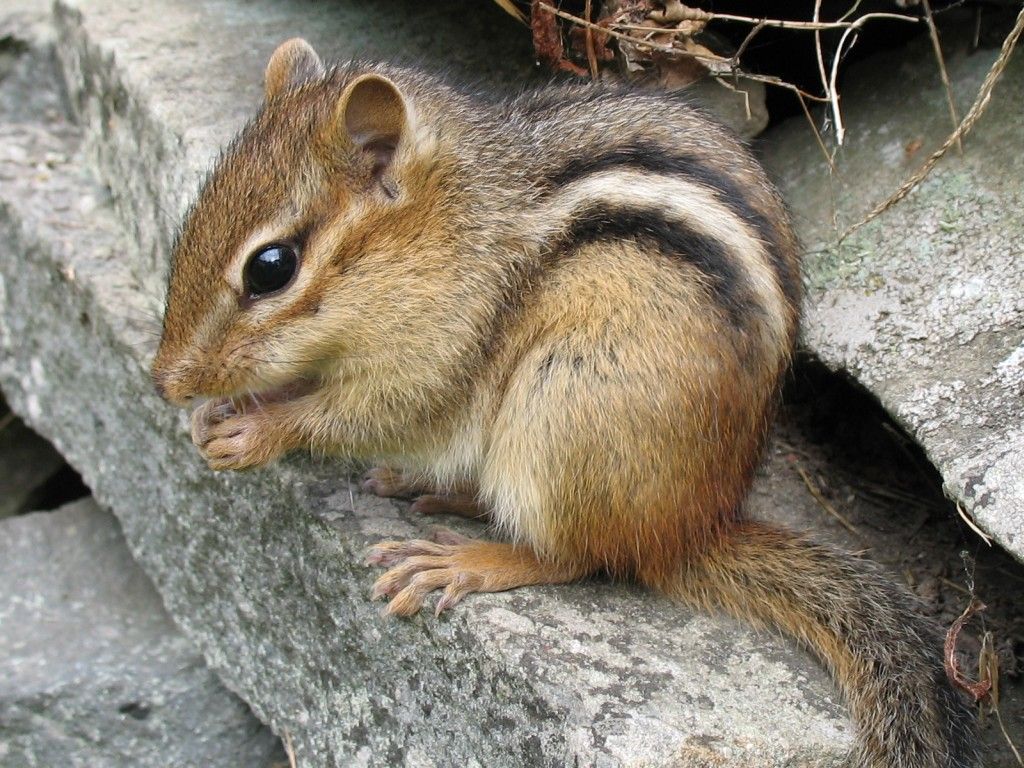
The hardest thing to notice in Nature is the date of an absence. When did the last junco leave in the spring? When did the last groundhog go into hibernation?
Right now eastern chipmunks (Tamias striatus) are busy gathering nuts to store in their underground burrows for the winter. As the season changes and temperatures drop they will disappear into their burrows to enter torpor, sleeping off and on through the winter.
The warm winters of climate change can fool them into not entering torpor but the result is deadly. Only 10% survive. Find out why in this vintage blog:
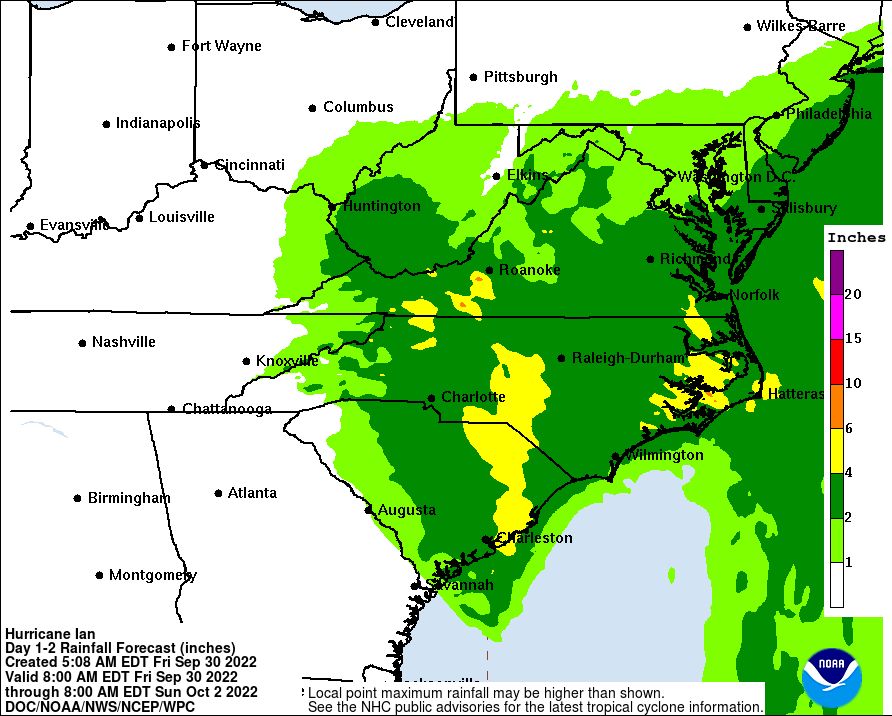
After wrecking a swath of Florida, Hurricane Ian popped out over the Atlantic Ocean, gained strength, and is bearing down on the Carolinas. Though Pittsburgh is quite far inland we will see the remnants of Hurricane Ian’s rain on Saturday.
These maps show total rainfall forecasts for the next three days as Hurricane Ian moves up the eastern U.S.
Quantitative Precipitation Forecast, Fri 30 Sep - Sat 1 Oct 2022 (map from NOAA)
Quantitative Precipitation Forecast, Sat 1 Oct - Sun 2 Oct 2022 (map from NOAA)
Quantitative Precipitation Forecast, Sun 2 Oct - Mon 3 Oct 2022 (map from NOAA)
Pittsburgh will receive less than an inch of precipitation because Ian is tracking south and east of here. Fortunately this is far different from our experience of Hurricane Agnes 50 years ago.
UPDATE 30 SEPT, 6 PM. I have corrected the captions on the slideshow based on an email from Dick Rhoton. Note that the slideshow maps show total rainfall potential, no matter what cause.
This map shows rainfall potential from Hurricane Ian alone — anything greater than an inch — as of 30 Sept 2022, 6am.
Hurricane Ian total rainfall potential, 30 Sep through 2 Oct 2022 (map from NOAA)
(maps and animation from NOAA; click on the captions to see the originals)
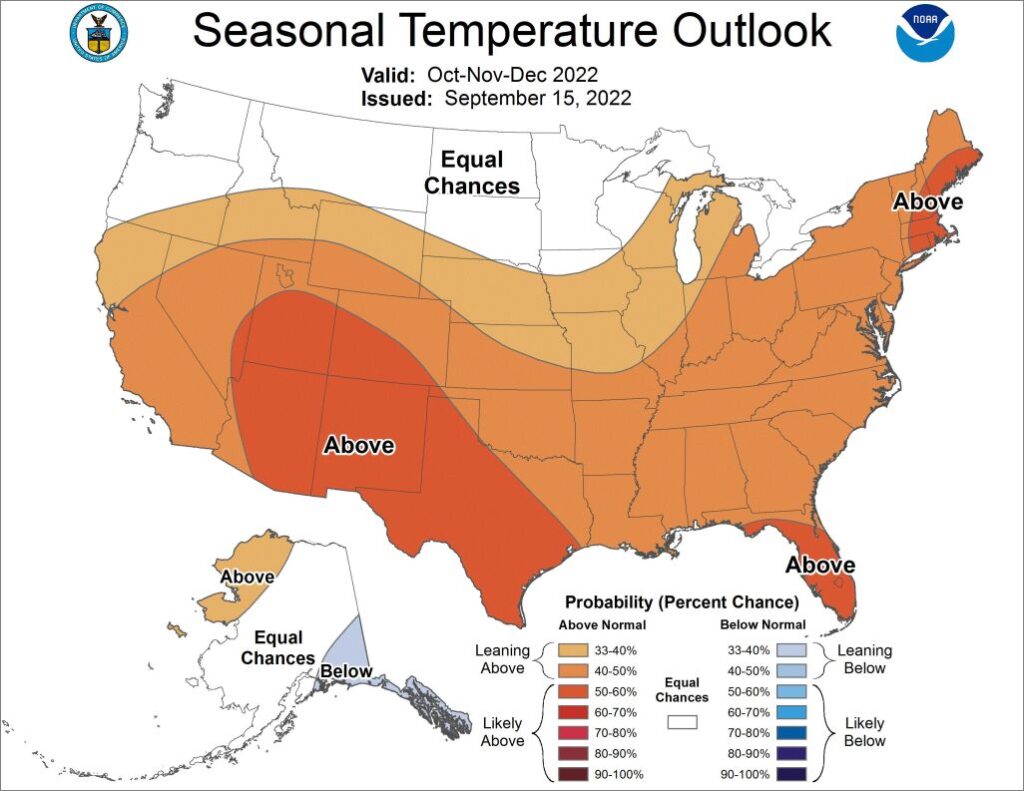
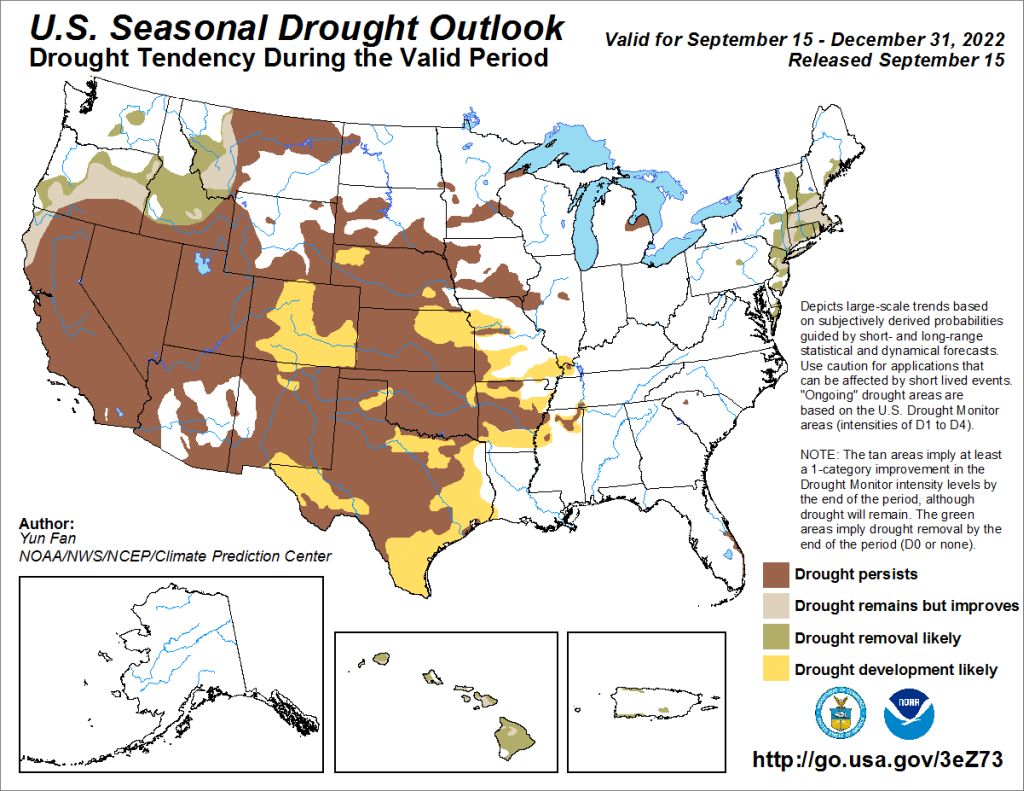
Now that summer’s heat is over we may be fooled into thinking climate change is no longer affecting us. Unfortunately, above normal temperatures are predicted for most of the U.S. for the next three months. Southeastern Alaska is the only place with any chance of being cooler than normal.
The seasonal drought outlook through the end of 2022 indicates New England will finally see a break in their drought, perhaps hastened by rain from a downgraded hurricane. But there is no help for the American West where the drought persists and gains new ground (see yellow on the map).


")
")
")
")
")
")


")