Category Archives: Climate Change

Looking Back: Solastalgia For Birds

(photo from Wikimedia Commons)

6 September 2022

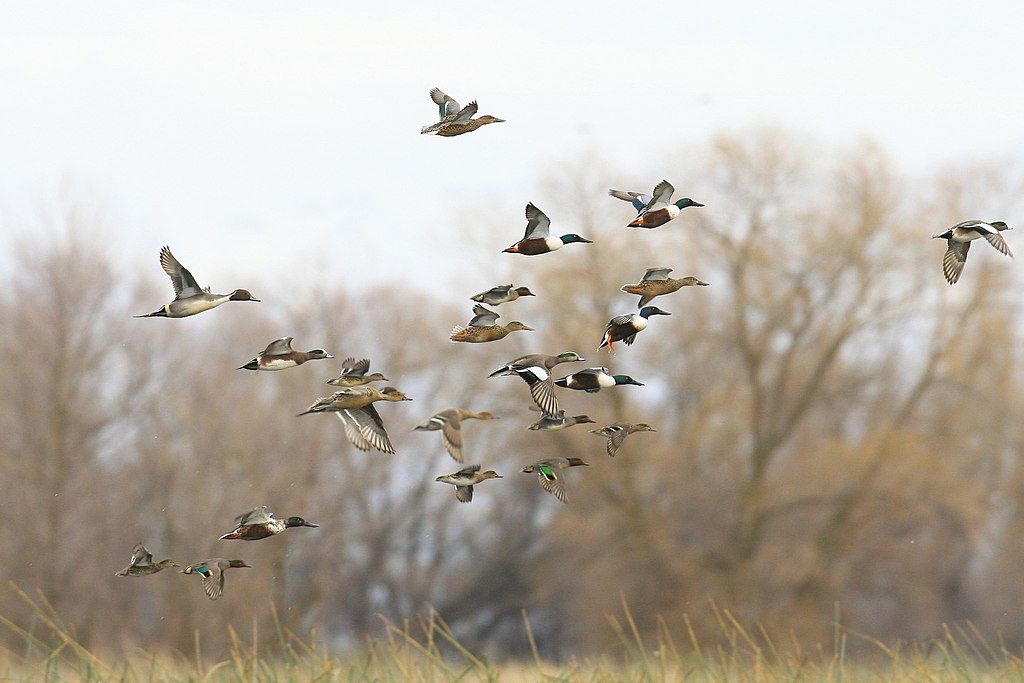
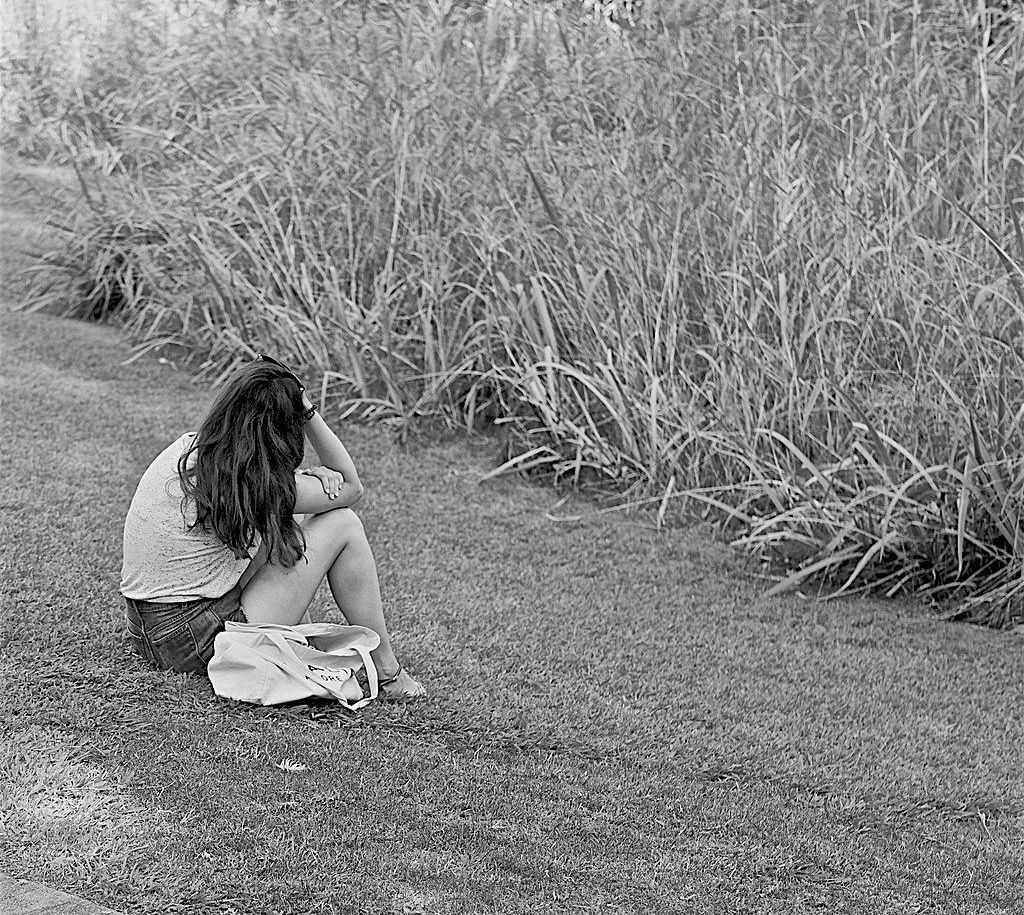
During fall migration bird numbers are at their highest as the adult population is joined by their recent young. I look forward to the variety of fall warblers and large flocks of chimney swifts, but this year — again — there are fewer migrants than I remember. My mood is dampened by solastalgia for birds.

Solastalgia is a new concept developed to give greater meaning and clarity to environmentally induced distress. As opposed to nostalgia–the melancholia or homesickness experienced by individuals when separated from a loved home–solastalgia is the distress that is produced by environmental change impacting on people while they are directly connected to their home environment. 

— US NIH: Solastalgia: The distress caused by environmental change

A 2019 bird population study headed by Cornell Lab of Ornithology quantified what I’ve been sensing. In the 50 years since 1970 North America’s total population of birds dropped by 3 billion. However it feels more recent because it has not been gradual. Half of that loss occurred in the past 15 years.

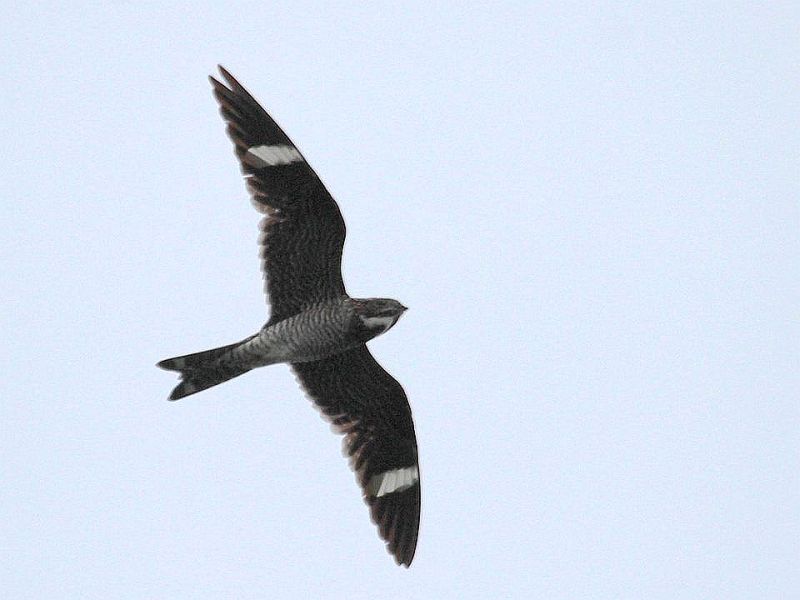
Fourteen years ago I noticed a decline in common nighthawks (Chordeiles minor) that used to migrate in flocks of 10-20 over my old neighborhood during the 20th century. In 2008 their numbers dropped precipitously. Nowadays I am lucky to see a single bird.

Common nighthawk (photo by Chuck Tague)
Common nighthawk (photo by Chuck Tague obtained in 2015)

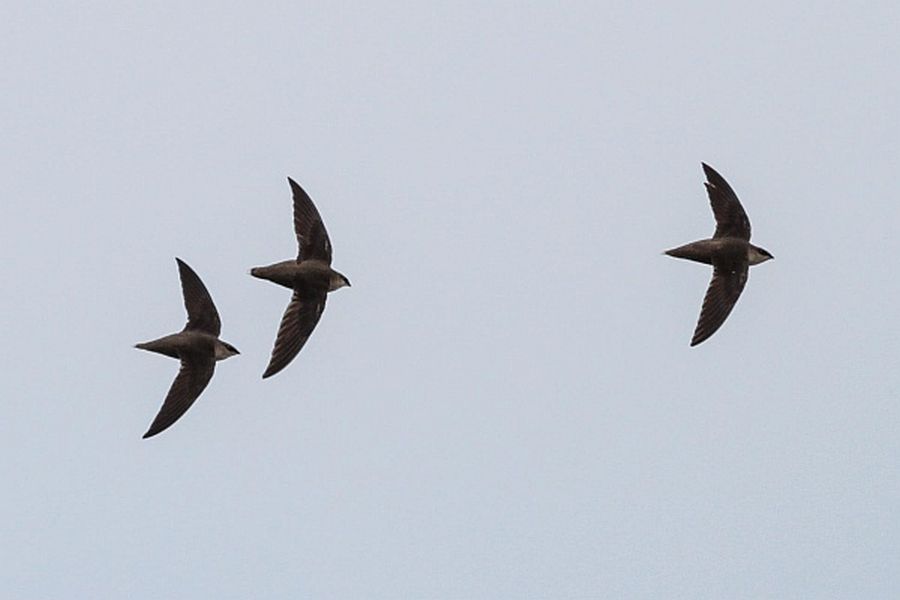
Chimney swifts (Chaetura pelagica) were my consolation but now they prompt solastalgia. Two years ago I counted more than 2,200 swifts roosting at Cathedral Mansions chimney during fall migration, but just last year their numbers declined sharply. My highest count in 2021 was only 100. Fifty is my highest count so far this year.

Chimney swift trio (photo by Jeff Davis obtained in 2013)

Solastalgia is aptly summed up: “Sometimes you leave a place. Sometimes it leaves you.

Despite the sense of loss it is still good to be outdoors, it is still lovely to look at birds, and it is healthy to let go of the past and gracefully embrace the present.

For more information on bird decline and some good vibes for the future see 3billionbirds.org.

(see photo captions and links for the credits)

Antarctica is Melting Faster Than We Thought

Icebergs in Antarctica (photo from Wikimedia Commons)

15 August 2022

The ice on Antarctica is a dynamic system that gains 2000 cubic kilometers of ice per year from precipitation and loses it to melting and icebergs. Unfortunately the continent is losing more ice than it gains. This month two new studies from NASA JPL revealed that the ice is disappearing twice as fast as previously estimated.

Researchers found that the edge of the Antarctic ice sheet has been shedding icebergs faster than the ice can be replaced, doubling previous estimates of ice loss from Antarctic’s floating ice shelves. Ice loss from calving has weakened the ice shelves and allowed Antarctic glaciers to flow more rapidly to the ocean, accelerating the rate of global sea level rise. …

In fact, the findings suggest that greater losses can be expected: Antarctica’s largest ice shelves all appear to be headed for major calving events in the next 10 to 20 years.

NASA Studies find previously unknown loss of Antarctic ice sheet
The 200-foot-tall (60-meter-tall) front of the Getz Ice Shelf in Antarctica is scored with cracks where icebergs are likely to break off (photo from NASA/GSFC/OIB)

In the interior of the continent ice loss is much harder to see as melt water seeps through the ice into lakes and streams beneath, then to the sea. The only clue to this melt is that the glaciers lose altitude.

To measure this ice loss NASA analyzed data gathered by satellites passing over Antarctica from 1985 to 2020. The illustration below shows a pass made by the ICESat-1 satellite whose mission ended in 2010.

ICESat data swath over Antarctica (image from Wikimedia Commons)

NASA’s map of the elevation changes shows that a few places gained elevation (blue) but more of them lost. The worst melting was in the red zones.

(map from NASA JPL, arrow added by Kate St. John)

Why does this matter?

As the glaciers melt on Antarctica and Greenland their water raises sea level around the world, but the rise is not equal everywhere. Uneven gravitational forces cause tiny elevation changes in sea level, called sea level fingerprints, that peak in the tropics and have the deepest valleys near melting glaciers. Those few cities near melting glaciers will see a drop in sea level while those farthest away from glaciers will have the highest rise.

For instance Reykjavik, Iceland, which has melting glaciers of its own and is close to Greenland, will see a net loss of sea level (below).

Meanwhile New York City and London will see a big sea level rise because of Antarctica + Greenland. (For more information see Which Glaciers Will Flood Your City.)

To those far from Antarctica, it will be bad news that the ice is melting so fast.

See NASA’s Antarctica studies at NATURE: Antarctic calving loss rivals ice-shelf thinning and ESSD: Elevation change of the Antarctic ice sheet 1985-2020.

(icebergs and ICESat illustration from Wikimedia Commons. All other media from NASA. Click on the captions to see the originals)

So Hot. Getting Hotter

22 July 2022

This week has been and will be unusually hot around the world. On Tuesday in Britain, where there is virtually no air conditioning, the high temperature was a record-breaking 40.3 degrees Celsius, 104.5 degrees F! It was as hot as Phoenix, Arizona without the respite of air conditioning and community cooling centers.

Red sun through smoke of the Woolsey Fire, California, 9 Nov 2018 (photo from Wikimedia Commons)

Back in the 1970s and 1990s climate change was slow to ramp up so we fooled ourselves by saying (1) Nothing’s changed yet so it’s not going to change, and (2) Climate change will be manageable because it won’t happen fast.

Wrong on both counts. This animation from NASA Goddard Institute of Space Studies shows world temperature anomalies in Fahrenheit, 1880 – 2021. The fastest changes have occurred in the last 5-10 years!

Temperature anomalies in Fahrenheit, 1880-2021 (from NASA, Goddard Institute of Space Studies)

So hot! And getting hotter.

(photos from Wikimedia Commons, animation from NASA Goddard Institute of Space Studies)

Today’s Flood is Tomorrow’s High Tide

High tide in Miami, 16 Oct 2016 (photo from Wikimedia Commons)

27 February 2022

Much of the coastal U.S. floods during violent ocean storms but some places, like Miami, flood several times a year during high “spring” or “king” tides because of climate-driven sea level rise. This month a new report from NASA and NOAA recalculates how deep the water will be just 30 years from now. It doesn’t look good.

By 2050, the average rise will be 4 to 8 inches along the Pacific, 10 to 14 inches along the Atlantic, and 14 to 18 inches along the Gulf.

WIRED Magazine: Sea Level Rise Will Be Catastrophic—and Unequal

As Wired Magazine points out, these amounts are averages because water basin topography, water temperature (warmer water takes up more space), land subsidence, and glacial rebound make unique results for each location.

Comparing just two cities on different coasts neatly illustrates what a striking difference these factors can make. Galveston, Texas, where the land is slumping, could see almost 2 feet of rise by the year 2050. Meanwhile, Anchorage, Alaska, could see 8 inches of sea level drop, thanks to the fact that its land is actually rising following the departure of long-gone glaciers.

WIRED Magazine: Sea Level Rise Will Be Catastrophic—and Unequal

The report indicates that a 2-foot rise is already locked in for 2100 because of past greenhouse gas emissions. If we don’t stop emitting *now* we can expect an additional 1.5 to 5 feet for a total of 3.5 to 7 feet by the end of this century.

NOAA’s Sea Level Rise Viewer shows Galveston, Texas, below, in three scenarios: current sea level, +2 feet (expected by 2050) and +7 feet (in 2100 if nothing changes). In 30 years Bayou Vista, Tiki Island and Jamaica Beach will be gone. A 7-foot rise by 2100 wipes out most of the area.

  • Galveston, Texas at current sea level (map from NOAA Sea Level Rise Viewer)

No matter what happens the results will be unequal. Southern Alaska (blue dots) looks good under both scenarios. The Gulf and Atlantic coasts will be in various degrees of trouble.

The report is sobering because it’s unfolding so soon. If you’re 30 years old now, some Gulf Coast places will be gone by the time you’re 60.

Road Ends in Water (photo by eagle102 on Flickr via Creative Commons license)

Today’s catastrophic flood will be tomorrow’s high tide.

Curious about your favorite coastal places? Look them up on NOAA’s Sea Level Rise Map Viewer.

(images from Wikimedia Commons, NOAA’s Sea Level Rise Viewer and NASA & NOAA’s 2022 Sea Level Rise Technical Report; click on the captions to see the originals)

Warmest Ever, Yet Again

Sunset over the Atlantic (photo from Wikimedia Commons)

20 January 2022

Now that 2021’s global temperature data has been finalized we know the score.

2021 is one of the seven warmest years on record. The warmest seven years have all been since 2015, with 2016, 2019 and 2020 constituting the top three.

2021 One of Seven Warmest Years on Record, wmo data shows

Here are the Top 10, all within very recent memory.

If you’ve lived in the northern hemisphere for the last 50 years, things have changed dramatically in your lifetime.

image from Wikimedia Commons

But a static map doesn’t tell the story. In NASA’s Global Temperature Anomalies from 1880 to 2021 watch how the temperature changes for your home area since 1880.

Warmest ever. Yet again.

(photo, table and map from Wikimedia Commons, animation from NASA Scientific Visualization Studio; click on the captions to see the originals)

In December, Alaska Was Hotter Than Pittsburgh

A few of the record temperatures in Alaska on 26 December 2021 (map from data source: Alaska Geospatial Data Clearinghouse via Researchgate, data from National Weather Service Alaska)

5 January 2022

On 26 December 2021 the record high temperature for Alaska — for the entire state — was set at Kodiak Island when it reached 67oF at a tidal gauge. This was so unusual that the National Weather Service triple checked to make sure. Kodiak Airport was 65 degrees, Cold Bay was 62.

Pittsburgh also had record heat in December 2021 but not as hot as Alaska. Our record-tying high was 64oF on 16 December.

Meanwhile, across the Gulf of Alaska from the record heat was a record low temperature of 0 degrees F at Ketchican.

How could Alaska have such high and low extremes on the same day? The wildly wobbling jet stream pushed warm air up the western side of the Gulf of Alaska and poured cold air down its eastern side. This jet stream map, centered on the Gulf of Alaska, is explained at Axios: Alaska sets December temperature record at 67 degrees.

[image embedded from Axios] Wind speed and direction at about 30,000 feet above the surface on Dec. 26 centered on Alaska. This shows the northerly bend to the jet stream, which allowed milder air to flow in from the south. (Earth.nullschool.net)

The extremes caused trouble throughout Alaska as unusual rain turned to ice and heavy snow. Alaska is definitely the poster child for climate change.

(map from data source: Alaska Geospatial Data Clearinghouse via Researchgate, tweets from @NWSAlaska, jet stream winds from earth.nullschool.net embedded from Axios)

The Normal Temperature Has Changed

Annual U.S. temperature compared to the 20th-century average, using Climate Normals 1901-1930 to 1991-2020. (NOAA NCEI)

17 December 2021

We often hear the word normal on the weather report as in: “Today’s high was 64 degrees F with a low of 49F and was 23 degrees above normal.” (That was yesterday’s temperature in Pittsburgh and, yes, it was 23 degrees above normal.)

Climate normals are always a 30-year average of temperature and precipitation as recorded at each U.S. weather station. Recalculated at the end of each decade, the new normals announced in May 2021 are based on the most recent 30 years of data: 1991-2020.

Normal is a rolling average and it keeps getting hotter. The 10 maps above compare each decade’s normal temperature to the 20th century’s average. We have moved from cool blue (top left) to angry red (bottom right).

Normal might not feel hot for people in their early 30s because it’s what they remember throughout their lives, but for retired people like me the current normal is the climate of less than half my life.

I remember the snowy Decembers of my youth. Even without the graphs I can tell the normal temperature has changed.

For more information on the current climate normals and the trend in precipitation (which is not trending in one direction), see NOAA, 1 May 2021: The new US Climate Normals are here.

(map from NOAA NCEI)

Why Aren’t The Ducks Here Yet?

Mixed ducks in flight, San Luis National Wildlife Refuge, Jan 2008 (photo from Wikimedia Commons)

8 December 2021

Fifteen years ago Pittsburgh birders waited for migrating waterfowl to start arriving in late October and watched as numbers peaked in November and dropped when our lakes froze in December. We remember that schedule and have been visiting wetlands since late October but waterfowl are still scarce. Low variety, low numbers.

Why aren’t the ducks here yet?

In a word, it’s not cold enough.

Except for the few species that are hardwired for more dependable long-distance migrations, such as blue-winged teal, waterfowl are adapted to migrate only as far as is necessary for them to find food, open water, and places to rest. For some species, it may take several consecutive days of freezing temperatures and snow cover to push them southward. 

— Ducks Unlimited: Are Waterfowl Migrations Changing?

Ducks save energy and avoid danger by staying put when conditions allow. They also shortcut their trip north in the spring by not traveling too far from their breeding grounds.

There was no reason for ducks to fly south in October, which was the world’s fourth warmest on record. November was also warm with no highs below freezing in Erie, PA and only four days completely below freezing in typically cold Bismarck, North Dakota. As of Monday December 6 the Great Lakes were completely ice free.

NOAA CoastWatch Great Lakes Ice Analysis. NO ICE as of 6 Dec 2021

So we’ll just have to wait for a week of real winter before we’ll see good flocks of migrating ducks.

Follow the weather up north to get a prediction of waterfowl arrival. Did it freeze in Saskatchewan, Manitoba or Ontario? Did the Great Lakes start to freeze? What about Lake Erie? (click the link to see Great Lakes ice conditions.)

When the ducks get here they might not leave until spring if our lakes stay open.

Mixed ducks in Ohio, March 2014 (photo from Wikimedia Commons)

p.s. Yesterday’s high was below freezing but we’re not having a run of cold weather. Friday’s high will be 52oF, Saturday’s 64oF.

(photos from Wikimedia Commons, map from NOAA; click on the captions to see the originals)

The Leaves Lingered

Though most trees are bare, the hilltop oaks still have leaves on 30 Nov 2021 (photo by Kate St. John)

4 December 2021

Last weekend many homeowners in Pennsylvania were annoyed that they had to rake leaves after Thanksgiving. A decade ago this would never have happened because the trees were bare by 5 November. Nowadays the leaves linger. Our warmer climate keeps them on the trees.

The delay in leaf drop has been increasing for at least a decade. In 2008-2012 most of the trees were bare by 2 or 4 November. In 2017-2021 the trees waited until 25-30 November. (*)

Meanwhile the height of fall color is later and lackluster. Twenty years ago we used to go leaf peeping on Columbus Day. This year the height of color in Schenley Park was on 13 November and not particularly breathtaking.

Fall color at Westinghouse Memorial in Schenley Park, 13 Nov 2021 (photo by Kate St. John)

Trees need a particular weather combination to trigger fall colors and leaf drop.

The timing and quality of color changes depend on a combination of temperatures, precipitation and sunlight. The best fall color displays occur after sunshine-filled days and cooler nights, following healthy doses of rain in the summer.

Washington Post: Fall foliage flopping: How climate change is dulling and delaying your leaf peeping

But it was way too warm in October. In fact it was the world’s fourth warmest on record.

U.S. Temperature Outlook for October 2021 issued 30 Sep 2021 by National Weather Service

The leaves lingered and finally by 30 November 2021 most of the trees were bare. Note that this date and all dates mentioned above are assessments of this same hillside in Schenley Park.

More than half of the trees are bare, Schenley Park, 25 Nov 2021 (photo by Kate St. John)

Read more about the disappointment of this fall’s foliage — and the economic impact — at the Washington Post: Fall foliage flopping: How climate change is dulling and delaying your leaf peeping.

(photos by Kate St. John, map from the National Weather Service)

First Killing Frost?

Frost (photo by It’s No Game via Flickr Creative Commons License)

4 November 2021

This morning Pittsburgh’s official temperature dipped to 28 degrees F at 5:51am at Pittsburgh International Airport(*) and 27 degrees an hour later. This is long enough and low enough(**) to be the first killing frost of the winter.

Weather Conditions for Pittsburgh International Airport, 4 Nov 2021 through 6:51am (image from NWS)

However, we still haven’t had a killing frost in some parts of Pittsburgh. Where I live in Oakland the low was only 31 and at the Allegheny County Airport in West Mifflin, 6.5 miles south of me, the temperature dropped briefly to 30, then rose to a steady 31.

Weather Conditions for Allegheny County Airport, 4 Nov 2021 through 6:53am (image from NWS)

Did we have a killing frost?

If you live in suburbs your garden died this morning. If you live in the city it may be fine except for very tender plants.

The City of Pittsburgh is usually 5 degrees warmer than the suburbs. That’s a big reason why crows come to town for the winter.

(photo of frost by It’s No Game via Flickr Creative Commons License, Pittsburgh weather data from NOAA.gov/zoa)

(*) Until the official data is published later today I assume that Pittsburgh International was the same temperature as Pittsburgh’s official weather station in Coraopolis, 2.88 miles away.

(**) 28 degrees F is generally considered the temperature of a killing frost and is certainly true for corn and soy farmers. Tender garden plants, such as impatiens, die just below freezing.