
As ice sheets melt around the world, fresh water that used to be held on land is pouring into the ocean and sea level is rising. But it’s not rising uniformly. The transfer of mass (water) from land to sea causes changes in Earth’s gravity field. Mirroring the ripples in gravity, the water is high in some places and low in others like the ridges on a fingerprint.
The mysteries of gravity *
Gravity is a force of attraction. It works on everything and in both directions. The Earth’s mass pulls you toward it while your mass pulls Earth toward you. The bigger the mass, the stronger the object’s gravitational pull. Greenland with an ice sheet on top has more mass than Greenland without one, so as the ice melts Greenland’s gravitational pull goes down.
As Greenland’s gravity wanes it doesn’t hug the ocean to its shore like it used to. The water has to go somewhere so it rises in the tropics. The effect is tiny, measured in millimeters per year. The pattern is called a sea level fingerprint.
The pattern revealed
Many things contribute to sea level at any given point including the Moon’s gravitational pull (causing tides) and the wind (causing waves) so it took lots of data and some serious number crunching to reveal Earth’s gravitational fingerprint. The data came from the GRACE satellite project.
GRACE satellites have been circling the Earth since 2002, measuring the pull of gravity on the globe below. (Here’s how GRACE works.) Each orbit provides a snapshot. Years of data show the change in gravity over time. Most gravitational changes are due to the movement of water, especially groundwater.
Using GRACE data, scientists from NASA and the University of California Irvine mapped gravitational changes affecting sea level from 2002 to 2014, shown on the map below. Blue means low water, red is high. The calculations were verified using readings of ocean-bottom pressure from stations in the tropics.
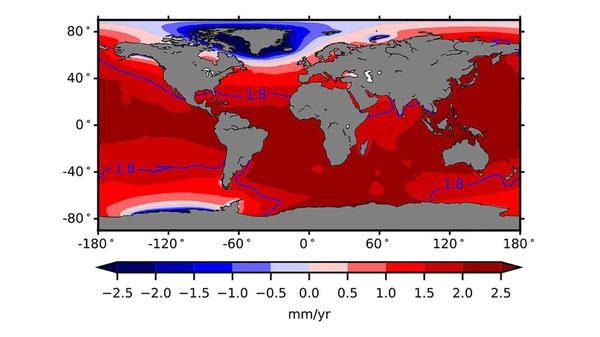
Image credit: NASA/UCI
Notice that the ocean has receded the most near Greenland at the rate of -2.5 mm/year. That’s 32.5 mm or 1.28 inches in the 13 years that GRACE measured it. As NASA explains:
The loss of mass from land ice and from changes in land water storage increased global average sea level by about 0.07 inch (1.8 millimeters) per year, with 43 percent of the increased water mass coming from Greenland, 16 percent from Antarctica and 30 percent from mountain glaciers.
Click here to read more about the study and see an animated map of sea level changes 2002-2014.
Unfortunately some of the hardest hit places will be tiny Pacific islands and Florida.
Who knew that the sea has a “fingerprint.”
(fingerprint image from Wikimedia Commons; click on the caption link to see the original. Sea level fingerprint map from NASA/UCI joint project using GRACE satellite data)
* p.s. Gravity is so mysterious that I initially described it incorrectly. Thanks to Dr. Allen Janis, I’ve corrected the description. See his comment below.
Hi Kate,
I saw a Red Winged blackbird today and singing too. I think the warm fall weather has him a little mixed up.
Gene
As a physicist, I feel duty-bound to correct your implication that the Earth pulls you more strongly than you pull it. Newton’s third law tells us the forces are equally strong. The accelerations they would produce if no other forces were acting would be vastly different, however. Newton’s second law says F = ma, so the small mass would have a large acceleration and the large mass a small acceleration (if no other forces were acting). You’re allowed an occasional error, Kate—I’ve learned so much from you!
Allen Janis, thank you! I will correct the blog though it may take some time for me to make the new text work. Oooo.
Are you the one living in the Pitts AREA?
Jack Christman, yes I am. After 10 years of the same design, I changed the ‘look’ of my blog last weekend. Everything else is the same. Here’s my About page: https://www.birdsoutsidemywindow.org/about/