
The computer said, “Those numbers are too high. They must be in error. Throw them out.” And so Barrow, Alaska disappeared from the climate analysis database.
Fortunately a lot of people missed Barrow when it was gone. In fact they suspected it might disappear some day because it’s so unusual. The error was found quickly and the raw data will be restored.
What happened?
This month more than a year’s worth of temperature data for the northernmost point in the U.S. — Barrow, or Utqiávik, Alaska (see arrow) — automatically disappeared from the National Centers for Environmental Information temperature analysis system because it looked so out of whack.

Why would a computer throw away real data?
Computers that collect automated weather data have algorithms that test for wild abnormalities so that instrument errors are isolated (rejected) from the clean data calculations. For instance, when a weather thermometer breaks or goes offline, the temperature is recorded as “zero.” When this happens in July in Pittsburgh it’s so obviously incorrect that the software rejects it. Algorithms for climate analysis are even more stringent because a change to an instrument’s location can look like a trend even though it isn’t.
Here’s why Barrow looks crazy to a computer. This graph by Derek Arndt at climate.gov shows circles for Barrow’s 1979-1999 average monthly temperatures, triangles for 2000-2017. Notice that for most of the year those 20-year averages are pretty close but for October, November and December they’re widely different. Computers don’t like that!
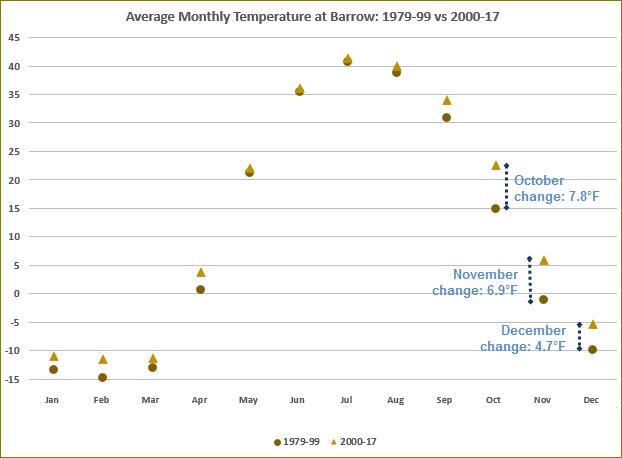
Barrow is experiencing rapid warming because there’s a lot less sea ice than there used to be. When ice crowds the shore in the fall, Barrow gets cold, but now the ice recedes so far in the summer that it takes months longer to reach the town.
It’s crazy warm in Barrow.
A tip of the hat to Angela Fritz at the Washington Post for her 12 December article that brought this to my attention. Read all about it at NOAA’s Beyond the Data blog: Alaskan North Slope climate change just outran one of our tools to measure it.
(photo and map of Barrow, Alaska from Wikimedia Commons. Graph from climate.gov. Click on the images to see the originals)
p.s. Barrow is now called by its native Alaskan name, Utqiávik.