
24 February 2019
We know our climate is changing compared to 30 years ago because we see obvious signs including:
- Average and peak temperatures are higher.
- Plants bloom and trees leaf out about two weeks earlier than they used to.
- We have more frequent heavy downpours, big rain events and floods.
- Glaciers that seemed stable 50 years ago are melting away.
- Sea level is rising.
Science predicted this more than a generation ago, but most of us couldn’t imagine how it would feel. Now that we’ve seen 30 years of change we’re anxious to know what our climate will be like in the future.
Matt Fitzpatrick and his colleagues at the University of Maryland Center for Environmental Science have answered this question by visualizing the future on an interactive map. Their study analyzes 540 cities in the U.S. and Canada, mapping their predicted climate in the 2080s to an existing climate today.
I tried out the map for myself at https://tinyurl.com/urbanclimate. I looked up Pittsburgh, PA of course and got the answer shown in the screenshot below.
It shows that Pittsburgh’s 2080 climate will feel like Jonesboro, Arkansas does today. Jonesboro is 665 miles away from here, near Memphis, Tennessee. (Click on the image to see the website. Use website controls to see more complex answers.)
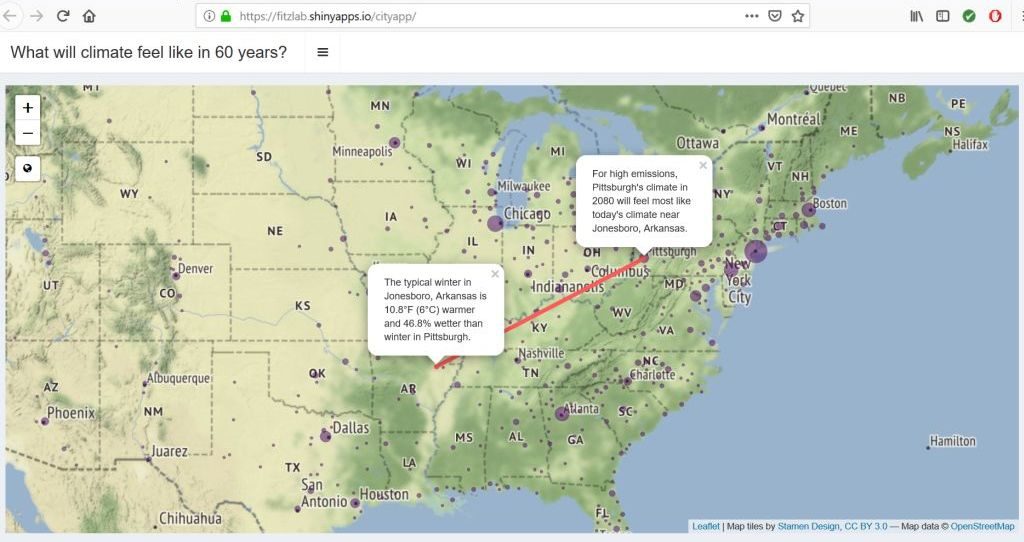
The map bubbles explain: Our winters will be 10.8F warmer and 46.8% wetter. Our summers will be 10F warmer and 17.6% drier.
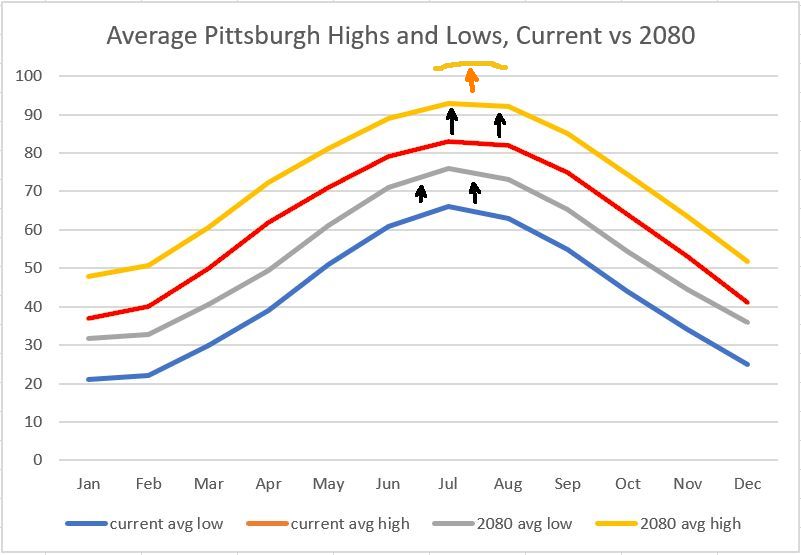
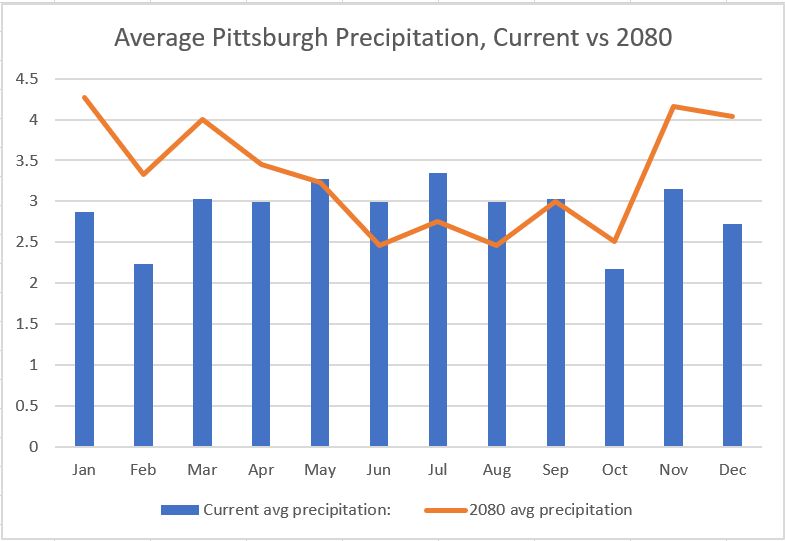
Let’s compare current to future using graphs. Pittsburgh’s current climate averages are shown below from U.S. Climate Data.
Sixty years from now our average winter lows will barely reach freezing. July and August average highs will be 93+ degrees F but watch out for the highest highs. August record temperatures in Jonesboro are all above 103oF!
Our precipitation will be really different. We’ll go from a fairly steady 3 inches of rainfall per month to a rainy season in November-to-May and a dry season June-to-October. This might resemble California’s wet (flood) and dry (fire) seasons.
Try the app for yourself at https://tinyurl.com/urbanclimate.
We’re in for a wild ride.
For more information read about the study here at University of Maryland Center for Environmental Science.
(credits: Cloud photo from Flickr, Creative Commons license. Map screenshot from https://tinyurl.com/urbanclimate. Pittsburgh current climate graph from U.S. Climate Data. Graphs of Pittsburgh’s future temperature and rainfall by Kate St. John. Click on the captions to see the originals)