Now that the birds are singing again and more singers will arrive on migration, it’s time to practice identifying songs by ear. Yes, it’s hard to do but it’s easier if you can visualize the song.
Just like a sheet of music, a spectrogram of bird song shows how the frequency (pitch) goes up and down. The black dashes graph the frequency and length of the notes. The brown wave graphs loudness in decibels.
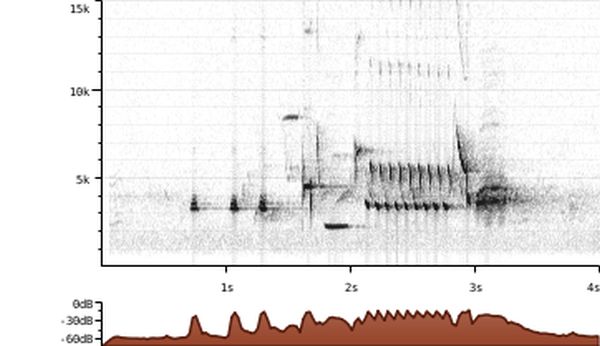
Play the matching audio to hear the graph: a song sparrow recorded by Ted Floyd, Xeno Canto XC374118.
This is just one example but you can learn to do it yourself and practice with two quizzes at Cornell Lab’s All About Birds.
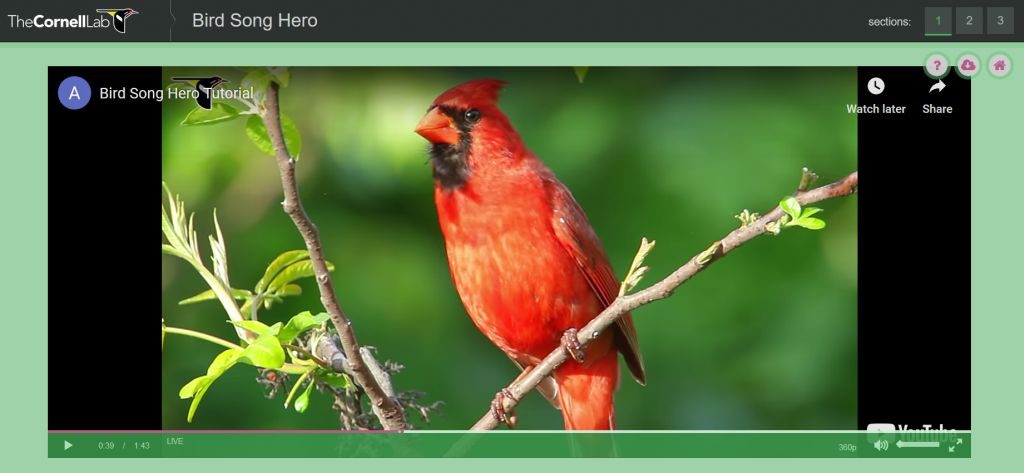
- Learn how to read the spectrograms that visualize bird song in this video: Bird Song Hero Tutorial.
- Two quizzes follow the video or you can try them independently at the Bird Song Hero Challenge. TIP: Watch the sonogram as it plays! Some of them are tricky.
p.s. Did you know that birds sing harmonies we can’t hear? On the song sparrow spectrogram, above, there are tall vertical dashes during the fast part of the song. The bird is harmonizing with himself in the 12,000 HZ frequency. If you’re older than 30-something, you probably can’t hear it.
(screenshot from Bird Song Hero tutorial (Cornell Lab of Ornithology, sonogram and audio from Xeno Canto XC374118 by Ted Floyd)
p.p.s Xeno Canto calls the graphs “sonograms.” It’s an older word for spectrogram. Here’s the difference between “spectrogram” and “sonogram.”
We always talked about “sonograms” when I was in grad school for Audiology in the 70s! (Ref: the spectrogram vs sonogram article (a nice article)).