27 November 2023
Last week a friend remarked on the wide variety of winter forecasts being touted for Pittsburgh from “Swamped With Snow” to “No Skis in Our Forecast.” How could the predictions be so different? I think it’s the Beltway effect.
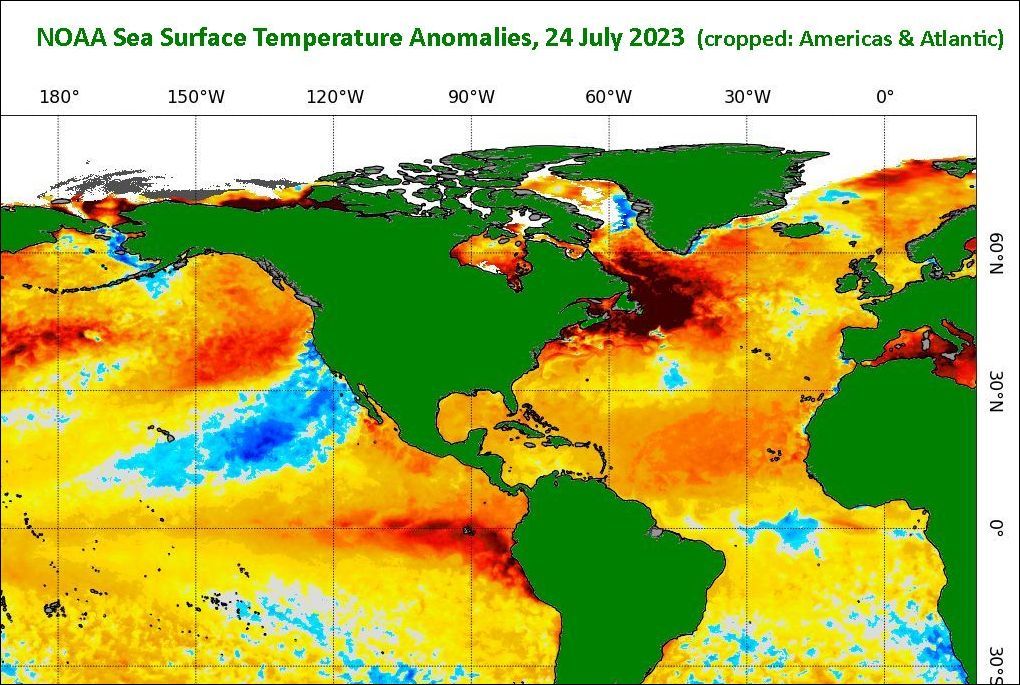
Right now the world is in an El Niño year of warm sea surface temperatures in the central and eastern Pacific at the equator and along the coasts of Ecuador and Peru.
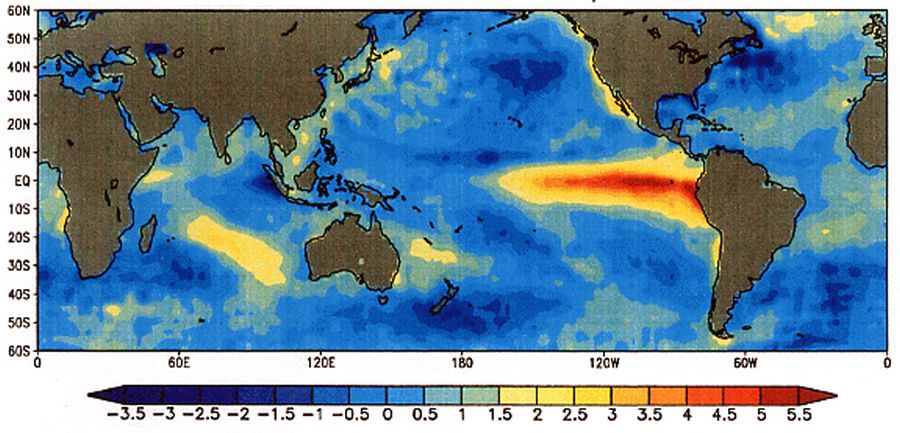
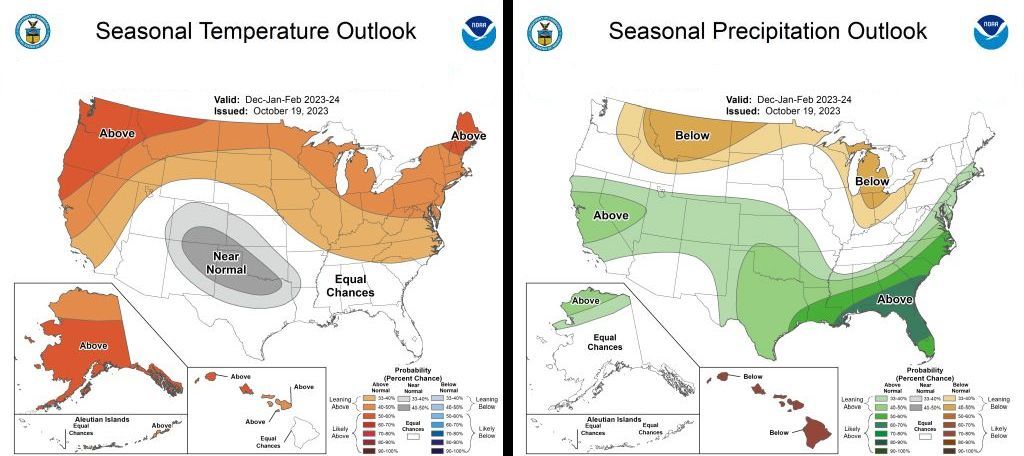
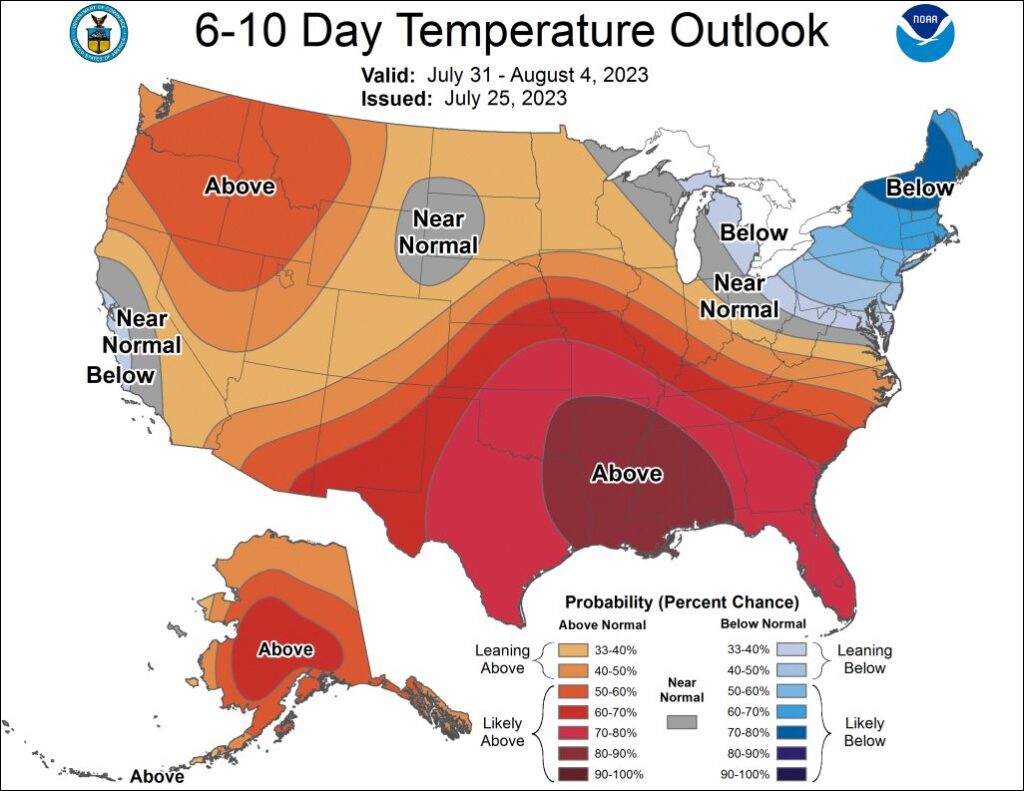
According to Wikipedia, this warming causes a shift in the atmospheric circulation with rainfall becoming reduced over Indonesia, India and northern Australia, while rainfall and tropical cyclone formation increases over the tropical Pacific Ocean. El Niño seriously affects South American weather and ripples out to North America as well. The U.S. seasonal outlook, Dec 2023 to Feb 2024, shows higher temperatures in the north and wetter weather in the south this winter.
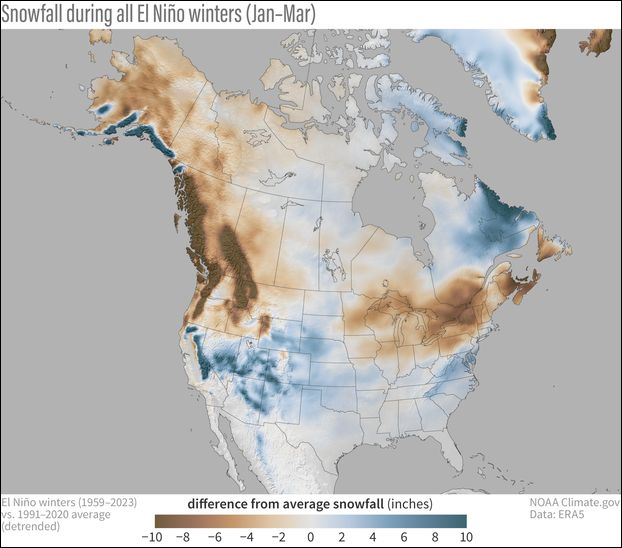
Of course this affects snowfall. El Niño’s winter history in 1959-2023 shows more snow in some places (blue color) and a lot less in others (brown color). Interestingly, Pittsburgh is in the Less Snow category while Washington, DC has More Snow than usual.
News organizations have a big presence in the DC Beltway area and write stories for the region. Some weather stories originate there and cross the Appalachians but when the news gets to Pittsburgh it might not apply to us. The typical example is when 2 feet of snow are forecast for D.C. and hardly any falls here. I think of this as the (DC) Beltway news effect.
So when we hear dire predictions for Pittsburgh’s winter this year I plan to wait rather then worry. My guess is that we’re likely to have rain.

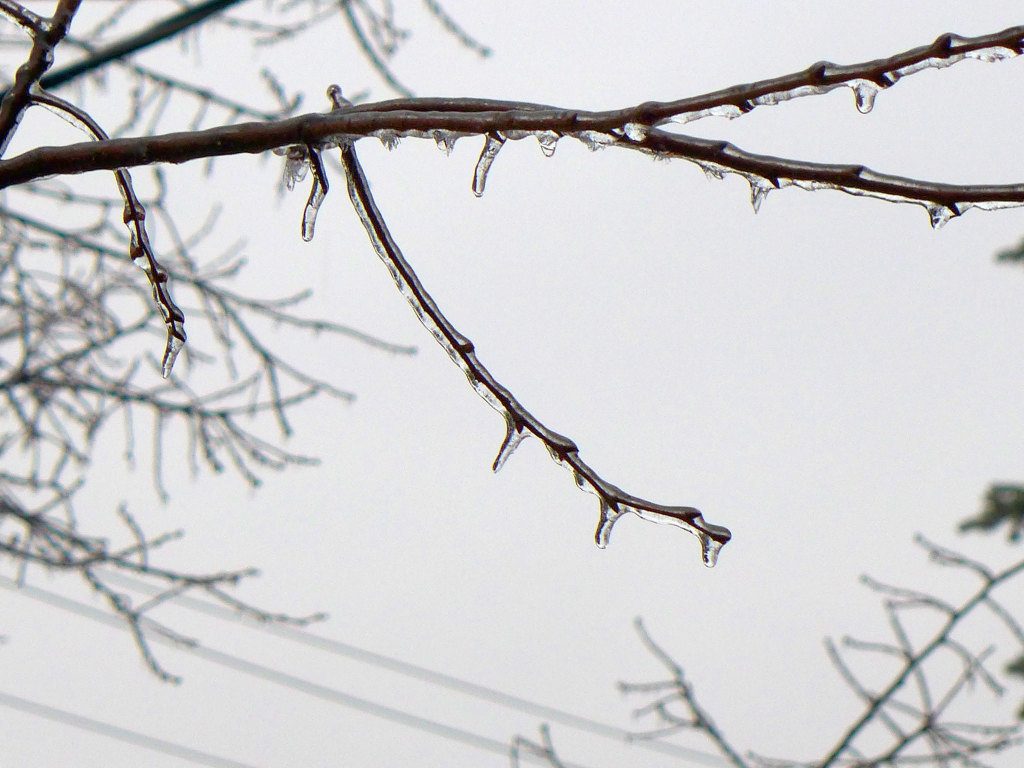
I sure hope the temperature doesn’t hover near freezing when it rains. Fingers crossed that we’ll be fine.
Read more about snow and El Niño at NOAA’s S(no)w pain, S(no)w gain: How does El Niño affect snowfall over North America?


")